The AAPG/Datapages Combined Publications Database
AAPG Bulletin
Figure
AAPG Bulletin; Year: 2014; Issue: October DOI: 10.1306/04301413177
Return to Full Text
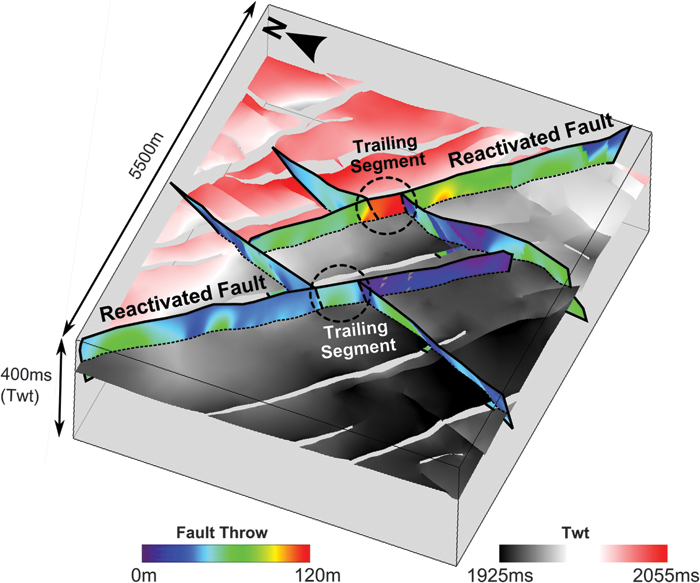
Figure 15. Three-dimensional diagram of north-northeast–trending fault planes that abut and locally reactivate west-northwest–trending fault planes and form a trailing fault segment that links two abutting faults. The distribution of throw is contoured onto each fault plane and shows increases in throw at the trailing fault segments. This example is taken from the SAG horizon. See Figure 3C for the locations of these faults within the fault network. TWT = two-way time.
Figure 15. Three-dimensional diagram of north-northeast–trending fault planes that abut and locally reactivate west-northwest–trending fault planes and form a trailing fault segment that links two abutting faults. The distribution of throw is contoured onto each fault plane and shows increases in throw at the trailing fault segments. This example is taken from the SAG horizon. See Figure 3C for the locations of these faults within the fault network. TWT = two-way time.