The AAPG/Datapages Combined Publications Database
AAPG Bulletin
Figure
AAPG Bulletin; Year: 2015; Issue: June DOI: 10.1306/01191513191
Return to Full Text
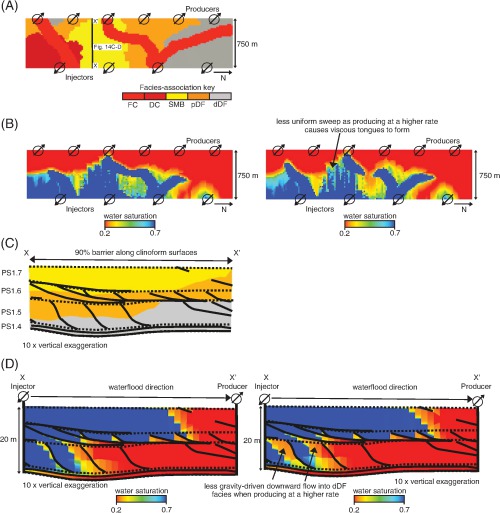
Figure 14
(A) Distribution of facies-association belts near the top of the model of stacked delta-lobe deposits containing channelized fluvial sandstones (FC) (with the coastal-plain deposits shown in Figure 3E removed), showing the location of injection and production wells. (B) Maps of water saturation for models containing 90% barrier coverage along clinoforms and non-zero vertical permeability ( of 7 md) in dDF deposits, with a low target oil production rate over 20 yr of
  (1100 bbl/day) (left) and a higher target oil production rate over 10 yr of
  (2200 bbl/day) (right). (C) Depositional-dip-oriented cross section showing the internal facies architecture of the modeled parasequences with barriers covering 90% of each clinoform (black lines) and parasequence-bounding flooding surfaces (dashed lines). (D) Depositional-dip-oriented cross sections showing water saturation at the end of production using the low target oil production rate (left) and the higher target oil production rate (right). Sweep efficiency is reduced when producing at the higher oil production rate. DC = distributary channel sandstones; SMB = stream-mouth-bar sandstones; pDF = proximal delta-front sandstones; dDF = distal delta-front heteroliths.
Figure 14
(A) Distribution of facies-association belts near the top of the model of stacked delta-lobe deposits containing channelized fluvial sandstones (FC) (with the coastal-plain deposits shown in Figure 3E removed), showing the location of injection and production wells. (B) Maps of water saturation for models containing 90% barrier coverage along clinoforms and non-zero vertical permeability ( of 7 md) in dDF deposits, with a low target oil production rate over 20 yr of (1100 bbl/day) (left) and a higher target oil production rate over 10 yr of (2200 bbl/day) (right). (C) Depositional-dip-oriented cross section showing the internal facies architecture of the modeled parasequences with barriers covering 90% of each clinoform (black lines) and parasequence-bounding flooding surfaces (dashed lines). (D) Depositional-dip-oriented cross sections showing water saturation at the end of production using the low target oil production rate (left) and the higher target oil production rate (right). Sweep efficiency is reduced when producing at the higher oil production rate. DC = distributary channel sandstones; SMB = stream-mouth-bar sandstones; pDF = proximal delta-front sandstones; dDF = distal delta-front heteroliths.