The AAPG/Datapages Combined Publications Database
AAPG Bulletin
Full Text
![]() Click to view page images in PDF format.
Click to view page images in PDF format.
AAPG Bulletin, V.
DOI: 10.1306/08101515059
A practical guide to the use of success versus failure statistics in the estimation of prospect risk
Frank J. Peel,1 and John R. V. Brooks2
1National Oceanography Centre, University of Southampton, Waterfront Campus, European Way, Southampton SO14 3ZH, United Kingdom; [email protected]
2National Oceanography Centre, University of Southampton, Waterfront Campus, European Way, Southampton SO14 3ZH, United Kingdom; [email protected]
ABSTRACT
Statistical data documenting past exploration success and failure can be used to inform the estimate of future chance of success, but this is not appropriate to every situation. Even where appropriate, past frequency is not numerically equivalent to future expectation unless the sample size is very large.
Using the rule of succession, we calculate the appropriate predicted chance of future success that can be used for smaller sample numbers, typical of exploration data sets, which include both successes and failures. The results, presented as a simple look-up table, show that the error that would result from using simple frequency instead of the appropriately calculated value is particularly severe for small samples (>10% error arising if N < 9). This error is least if the past success rate is close to 0.5, but it increases markedly if the past data consist of mostly failure or mostly success.
We review the conditions in which past frequency can be used as a guide and the circumstances in which it does not reflect future chance. Past success frequency should only be used as a guide to future chance if the past tests and future opportunities belong to the same play and are similar as far as the available data allow. They should not be used if the historical tests have selectively sampled the “cream” of the pool of opportunities.
INTRODUCTION
Obtaining an estimate for the chance of success is an important part of the decision to drill or not to drill a prospect. Many different methods are used to obtain such an estimate (see, for example, Rose, 1987, 1992, 2001; White, 1993). These may involve weighing the strength of geological evidence for the essential components of the hydrocarbon system and multiplying these to obtain an overall chance of success. They may involve observing seismic attributes (e.g., Forrest et al., 2010) and combining these with a geological prior chance to derive an updated chance of success (e.g., Newendorp, 1972) using Bayesian logic (Bayes, 1763) or other methods. Other tools include use of the Sherman Kent Scale (Kent, 1964), developed by the Central Intelligence Agency to translate verbal descriptions of likelihood into numerical probability, the solicitation of expert judgments (Hora, 2007), and aggregating the estimates of a set of individuals within a group to produce a more robust estimate (Hogarth, 1978), known as a “wisdom of crowds” approach (Surowiecki, 2004). The probability of a future outcome, obtained from such methods of rational analysis, is known as inductive probability.
One of the most basic (and potentially most powerful) tools in the armory of methods used to estimate the chance of future prospect success is the statistical analysis of past rates of success or failure, either of prospects as a whole (successes versus dry holes) or of a component of the hydrocarbon system. Baddeley et al. (2004) discuss the difference between statistical probability obtained by look-back methods and inductive probability derived from look-forward logic. For example, if we ascertain that cross-fault seal has failed in 6 out of a set of 60 tested prospects within a particular play fairway, the statistical historical success rate for that component of the prospect (0.9) could be used as a guide to our expectation of the likelihood of success of cross-fault seal in future well tests.
If we have good information on our prospect and a good understanding of the geological factors that influence its chance of success, we may use the statistical probability as a check (but not a hard constraint) on our rational (inductive) estimate of that chance of success. For example, we may have information that indicates that the chance of cross-fault seal is better in our prospect than it was in the prospects tested in the past.
However, if we do not have the luxury of good data on our undrilled prospect or we do not yet understand the geological factors that control the chance of success of its component parts, we may have to come up with an estimate of that chance based on past statistics alone.
As noted by the Securities and Exchange Commission (2008), “Past performance does not guarantee future results”; this is true in many fields, from investment to hydrocarbon exploration, and this warning particularly needs to be borne in mind when we use the results from previous exploration wells to constrain our estimate of the chance of success of an undrilled exploration prospect.
Publicly available literature contains little practical guidance as to how we should use the statistics from existing well data to guide prospect risking. Existing publications tend to focus on a comparison of predicted predrill chance of success with actual success rate (e.g., Allais, 1956; Rose, 1987, 1992, 2001; Alexander and Lohr, 1998; Harper, 2000; Ofstad et al., 2000a, b, c) or comparing discovered volumes versus predicted prospective resource (e.g., Rose, 1987; Capen, 1992; Fosvold et al., 2000; Ofstad et al., 2000a, b, c). While these look-back studies provide very valuable lessons about past performance, they are less helpful in suggesting how and when to use past well data to estimate the chance of success of a new prospect. It is our experience that many geoscientists in the petroleum exploration business simply equate past success rate to expected future chance of success, if they consider the past success versus failure statistics at all.
A well-established mathematical reason explains why, even where we want to use past statistics to inform our estimate of future chance, we cannot simply equate the frequency of past success to the expected chance of future success. If we have a set of n tests and s successes, using simple frequency to estimate the chance of success of the next test would give a probability of s/n, but the rule of succession of Laplace (1774) shows that the most likely chance of success that would generate this result is (s + 1)/(n + 2). For small sample sizes this gives a significantly different prediction from simple frequency. This result has not been explicitly applied to the problem of prospect risking in the petroleum exploration business. More significantly, this result has not been developed into an exploration-friendly consideration of how to estimate future chance of success of a prospect based on a data set that includes some failures as well as successes.
This brief paper sets out some simple guidelines as to when and where a statistics-based risk approach may be valuable, where it may be misleading, and how best to use small data sets.
Although we should always look at the statistics of previous well results and should always consider the lessons that can be drawn from those wells, common pitfalls exist. We will describe conditions in which the set of past tests should be representative of the remaining future opportunities and the conditions in which we should expect future success rate to be different from the past statistics. Differences between past performance and expected future delivery may arise for a variety of reasons. These include the following:
• “cherry picking” (testing the best prospects in a play first, leaving the less attractive ones until last);
• portfolio exhaustion (all the related prospects of a particular play are drilled out, so that new prospects within the same general area may have significantly different geological characteristics and a different risk profile); and
• the effect of prospect-specific information, such as seismic attribute analysis, which shows that the opportunity in hand appears better or worse than the set of historical tests.
Even where the set of past tests is appropriately representative of the remaining opportunities, the historic success rate is not equivalent to the expected future chance, especially for small data sets, as shown by the coin-in-a-bag example described below. We set out a method for estimating the most appropriate future chance based on small (N < 10) data sets.
DEFINITION OF TERMS
The definitions used in this article are consistent with the usage in Peel and Brooks (2015) and Peel and White (2015), to which the reader is directed for further clarification.
Chance of Geological Success of a Prospect
A prospect model defines the geological conditions envisaged in the success case (trap type, age and nature of the reservoir, etc.) and a numerical range of the parameters (reservoir thickness, porosity, hydrocarbon column height, etc.) that the success case is expected to deliver. The chance of success of a prospect is the current opinion, based on the knowledge and data currently available, that the geological model applies and that the values of the parameters that exist in the subsurface are correctly represented by the ranges defined in the prospect model. We use the notation Pg to represent the chance of geological success of a prospect, following Rose (1987, 1992, 2001); other notations are also used in the literature (see Peel and Brooks, 2015).
Many methods can be used to estimate Pg (e.g., Megill, 1977; Rose, 1987, 1992; White, 1993), many of which involve consideration of a diverse range of geological data and knowledge as well as past statistics. In this paper we focus only on the use of past performance statistics with the aim of better understanding how to use them; this does not imply that we do not recognize the value of the other inputs and methods.
Geological Success (of a Prospect or of a Risk Component of a Prospect)
Geological success means that the geological model defined as the prospect success case exists in the subsurface; the general geological description is valid, and the actual value of the components falls within prognosed range. For the prospect as a whole, success means that all these components combine to give rise to a hydrocarbon accumulation that falls within the prognosed volume range. We can consider the component elements separately, so that a well may test a successful outcome for (say) the reservoir model, even if another component fails and the prospect as a whole is not a success.
It is common to produce statistics that consider the historical success rates both of the prospect as a whole (e.g., Rose, 1987; Harper, 2000) and of the individual key geological components of the prospect (e.g., Ofstad et al., 2000c).
ESTIMATING FUTURE PROBABILITY FROM PAST STATISTICS
If the only information we have to base our estimate of the chance of future success on is the past statistics (Figure 1), the method for calculating the odds is rigorous, and it is quite nonintuitive. In many circumstances, the frequency of past success is not a good approximation of the chance of future success. If our data set consists of 10 wells, of which 9 were successes, we might intuitively think that the appropriate chance of success would be 9/10 = 0.9, but this is not correct (the best estimate is, in fact, 0.833). If our data set consists of three wells, of which three were successes, we might think the appropriate chance of success would be 3/3 = 1, but this also is not correct (the best estimate is 0.804). It is more intuitive if we consider a data set consisting of only one well, which was a success: the past success rate is 1/1, but any experienced explorer knows that one good result does not prove that the next well will work (the best estimate is 0.67). The method we use to obtain these best estimates is set out below.
 Figure 1. Problem: If all the information we have to go on is the raw success versus failure statistics of an analogous set of wells, how do we translate the number (75%) representing the frequency of past success into a go-forward prediction of the chance of success of an undrilled prospect (Pg)?
The reason for this difference between past frequency and future chance is that we are not trying to find the proportion of past success or failure; we are, instead, trying to find the most likely chance of success that would deliver that proportion, and this is not the same number.
This can be illustrated by a question used in interviews for financial traders (http://www.glassdoor.co.uk/interview); a variant was used as a Car Talk® puzzler (http://www.cartalk.com/content/red-card-green-card-0): “There are 3 coins in a bag. Coin 1 has tails on both sides, coin 2 has heads on one side and tails on the other side, and coin 3 has heads on both sides. I pick one coin from the bag and toss it. I get heads. What is the chance that the same coin will land heads if I toss it again?”
In this example, we know that each coin has a different probability of landing heads-up (0, 0.5, and 1.0), but we do not know which coin we have selected, so we do not know what the probability is for that coin. We can use the one test result to come up with a best estimate of that probability.
We know one result of one trial of the coin, and 100% of our trials found a head, but this does not mean that we can apply that same historic success rate as the chance of success for the next throw. A simple frequentist approach (i.e., using the frequency of past success) would suggest past rate = 1.0 = prediction of future chance, but it is intuitively obvious that this result is false. A more appropriate probabilist approach reverse-estimates that chance from the information we have (Figure 2). We know the range of possible chances for the three coins—0, 0.5, and 1.0—but we do not know which coin we have. The coins in the bag have six faces. One-third of the heads lie on coin 2, and two-thirds lie on coin 3. The likelihood that we selected coin 1 is zero (it has no head), the likelihood it is coin 2 is 1/3, and the likelihood it is coin 3 is 2/3. To obtain the go-forward chance of a head, we calculate the mean chance from the two coins: 1/3 × 0.5 + 2/3 × 1.0 = 5/6. The important lessons of this exercise for petroleum exploration are the following.
1. Past success rate is not numerically equivalent to predicted future chance.
2. It is possible to estimate that future chance using relatively basic logic and simple arithmetic.
 Figure 2. Graphical solution of the three-coin problem: reverse-estimating the go-forward probability from one observation. H = heads; T = tails.
ESTIMATION OF CHANCE OF GEOLOGICAL SUCCESS OF A PROSPECT FROM SMALL SUCCESS VERSUS FAILURE DATA SETS
We can apply a similar approach to the real-world situation of estimating the chance of success of a future prospect test, using only the knowledge of the results of previously tested prospects in the same play. We first make the assumption that in the absence of prospect-specific information, each of the drilled prospects had the same predrill chance of success, and the undrilled prospect has the same chance of success. We do not know what that chance of success was or is, but we have a record of past success rate, and we can use simple arithmetic to back-calculate what chance of success would be most likely to have generated the observed results.
This problem is not new, nor is it unique to petroleum exploration. Price (in the preface to Bayes, 1763) and Laplace (1774) both addressed the question known as the sunrise problem: What is the most likely chance of success that generates an uninterrupted set of n successes? The solution to this (the sunrise theorem) is that the mean chance that generates n successes out of n trials is (n + 1)/(n + 2). Laplace (1774) developed the more general rule of succession: If the data set consists of s successes out of n tests, the mean chance that generates this observation is (s + 1)/(n + 2). A graphical method of deriving these results is shown in the Appendix.
Applying this to petroleum exploration, we can calculate the mean chance of prospect success, Pg, that would give rise to an uninterrupted string of n exploration successes: Pg = (n + 1)/(n + 2). If we have no other information on which to base an inductive estimate, this mean chance is the appropriate estimate of Pg to use for our next prospect. The calculated Pg for a range of values of n is shown in Figure 3A and tabulated in the first column of Table 1.
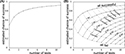 Figure 3. (A) Application of the Laplace (1774) sunrise problem, estimating the mean chance of success from the observation of a succession of 1 to 11 successful results. (B) Application of the rule of succession to estimate the mean chance of success based on a series of 1 to 11 results, including success and failure outcomes.
Similarly, the mean chance of success, Pg, that gives rise to s successes out of a data set of n tests is Pg = (s + 1)/(n + 2). Again, if we have no other information on which to base an inductive estimate, this mean chance is the appropriate estimate of Pg to use for our next prospect. The calculated Pg, for a range of values of s and n, is shown in Figure 3B and in Table 1.
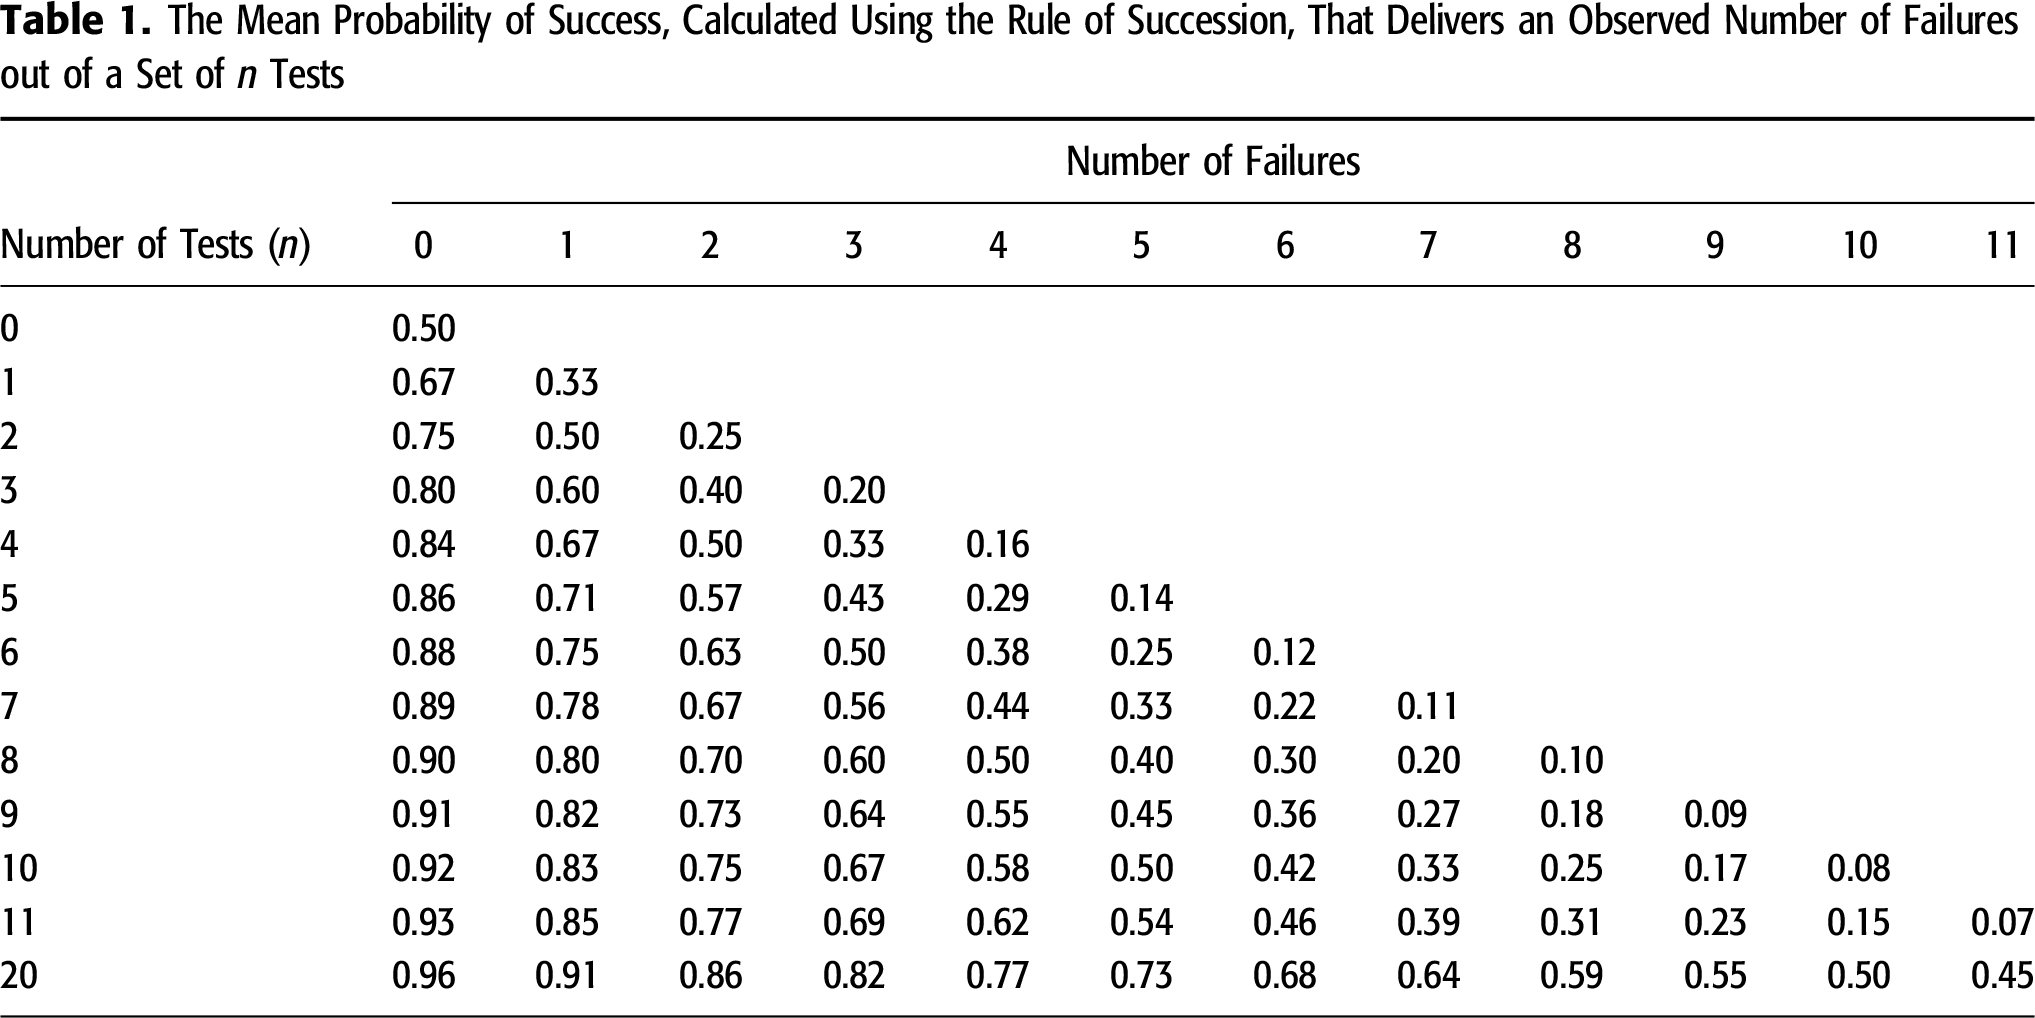
We suggest that the results shown in Table 1 can be used by exploration geoscientists as a simple method to translate past statistics into an estimate of Pg, where this is appropriate, and that this should be used in place of a simple frequency approach.
This approach can be used for Pg, the chance of success of the prospect as a whole, if the only information we have is that the historical data set consists of dry holes versus hydrocarbon discoveries. The same approach can also be used to obtain estimates of the chance of success of one or more of the independent risk components (such as charge, reservoir, trap, and seal) that are multiplied together to derive the overall Pg value. For example, we may have sound inductive probability estimates derived from geological data for charge, trap, and seal, but if the only information available for reservoir is that the reservoir is absent in 1 out of 10 well tests, we should use Table 1 to obtain an estimate of the chance of reservoir presence as 0.83 (or calculate this value using the rule of succession).
The main assumptions implicit to this approach are the same as those that constrain the general binomial probability formula: It depends on (1) the trials being independent, (2) only two possible outcomes existing for each trial (in the petroleum exploration world, these are success versus failure), and (3) the prior probability of success being the same for each trial. We know that no two exploration prospects are the same, and so we know that assumption 3 is unlikely to be true in the petroleum exploration world; however, in many situations we know so little about the details of the geology that the method may be a useful first step in the process of risking a prospect, and in some situations we know so little that it is the only method available to us.
The calculated mean probability shown in Table 1 can be compared with the simple frequency (=s/n) for the same n tests, as shown in Table 2.
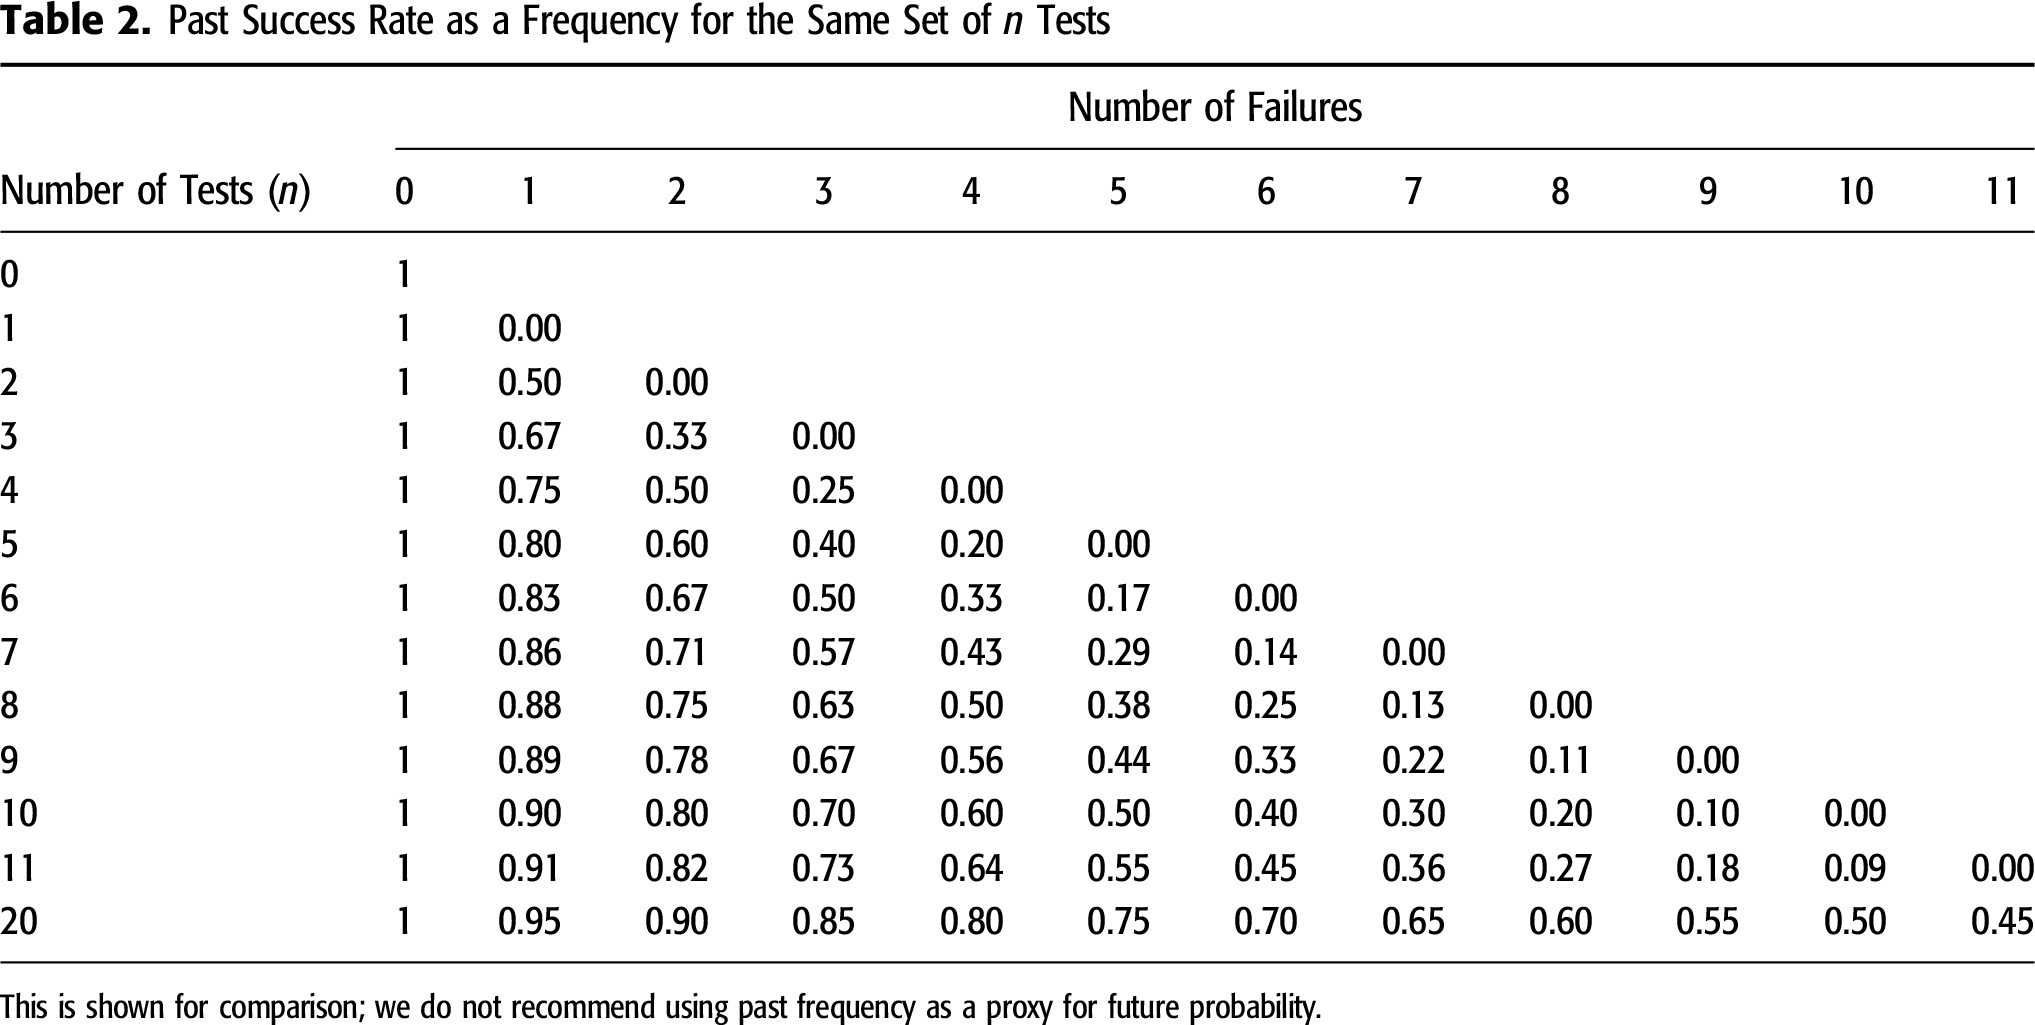
Table 3 shows a comparison of the calculated mean Pg using the rule of succession with the values that are obtained simply by taking the past frequency of success cases (=s/n). The comparison shows that for larger data sets (N > 8), the chance predicted by the two methods is similar (difference < 0.1), and probably either method is an acceptable approximation for the purpose of estimating prospect risk. However, for smaller data sets, especially those consisting of mostly successes or mostly failures, the difference is considerable, and the unmodified past frequency is not an acceptable approximation of future probability.

EXAMPLE: ESTIMATING THE CHANCE OF A SALT WELD SEALING
Using look-back statistics to estimate chance of success may be particularly important in situations where we have historical well data but very limited information on some aspect of the prospect, or we have weak understanding of the geological factors that determine the chance of success. As a result, it may be difficult to create an inductive estimate based on sound local observations and geological reasoning but possible to derive a valid estimate based on past performance statistics.
A situation in which this commonly arises is in the risking of subsalt prospects, where a critical part of the trap is poorly imaged. One such situation is shown schematically in Figure 4, showing a subsalt prospect that depends on a salt weld to seal. Given the difficulty of imaging the critical region, coupled with the current poor understanding of what conditions enable a salt weld to seal or allow it to leak, we may be unable to create a strong case for the chance of seal success based on local information, and a small data set of success versus failure statistics may be the only tool available to guide our risk estimate. In the case shown in Figure 4, our analog data consists of only four tests, which we believe are similar enough to our prospect to use for comparison: three cases in which we know a similar salt weld has worked as a sealing interface (prospects A, C, and D) and one in which we believe that the weld interface failed to seal (prospect B). From this limited information, we know the frequency of past success (s/N = 0.75), and we can use Table 1 to look up the mean probability that would give rise to this outcome: P(seal) = 0.67.
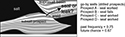 Figure 4. Use of limited well statistics to estimate the chance of a component of prospect risk (the chance of a salt weld sealing).
Thus, if we wish to use the past statistics as a guide to future chance, we should use the chance of success of the seal component as P(seal) = 0.67. Combining this probability by multiplication with the chance estimated for other independent risk components (such as charge, trap, and seal) in the normal way allows us to calculate the overall chance of success (Pg).
CONDITIONS IN WHICH LOOK-BACK STATISTICS, CONVERTED TO AN ESTIMATE OF FUTURE CHANCE, MAY BE APPROPRIATE AS A GUIDE TO FUTURE EXPECTATION
Past performance statistics should be used with caution because in many circumstances they are not an appropriate basis for estimating future chance. When considering whether past statistics are a valid constraint on future chance of success, the following conditions should be considered.
• All the information available to us should indicate that existing drilled prospects for which we have the statistics are good analogs for the undrilled prospects: they should test the same play, same geological model, same trap type, etc., and we should know of no reason why the remaining opportunities should be worse or better.
• The drilled prospects for which we have the statistics should be valid tests, e.g., drilled within apparent closure, in a reasonable location, and in a part of the prospect where we would expect the reservoir to exist if the geological model is correct.
• The wells were drilled using the same state of knowledge (for the drilled prospects) that we have now for the undrilled ones; in other words, we are not acting under a disadvantage that the previous drillers did not face, nor do we have major targeting advantages that were not available when the previous set of prospects were chosen for drilling. New technology may give us the ability to radically improve the expected chance of success for the prospects we choose to drill.
• The prospect we are interested in risking does not represent the “dregs” of a play that has been effectively cherry picked by the wells already drilled. The best, most obvious prospects with the highest perceived chance of success naturally tend to be tested first, if conditions allow. If the remaining prospects lie within the same pot of opportunities, it naturally follows that they represent the ones that were not previously deemed attractive drilling candidates. If the cherry picking included a consideration of risk, future chance of success is likely to be worse than historical performance.
If the selection of well tests was made on the basis of prospect volume and risk was not a consideration, the success versus failure statistics may be a valid reflection of future chance.
The most favorable conditions for using prospect success versus failure statistics apply when an area which has been extensively explored abuts against an area which has for some reason been protected from exploration, whether because of geopolitical imperatives (disputes, embargos, conflicts, change in tax conditions, etc.), technological constraints (e.g., water depth that was previously inoperable), or other reason. If we believe the geology is the same on both sides and no known factor would make the undrilled acreage better or worse, then the past statistics are probably appropriate for use in estimating Pg for prospects in the undrilled region.
Figure 5 shows a schematic situation that illustrates these principles. There has been intense drilling in the territorial waters of two countries, with 20 tested prospects in the same play delivering 8 successes. There has been no drilling in the disputed region. The historic success rate is 0.4, and this is a large enough sample size that the past frequency and the probabilistic prediction give the same result; expected chance of success of the next prospect, based on only these data, is 0.4.
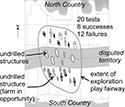 Figure 5. Illustration of scenarios in which past statistics may be a valid indication of future performance (undrilled prospects in disputed territory) and where they should be viewed with caution (a farm in an extensively drilled block).
In the disputed region, we expect the geology and prospectivity to be the same as in the tested areas. In the absence of any other geological information to refine our estimate, the past statistics are probably a good indication of the expected average Pg for the undrilled prospects in the disputed region.
Another exploration opportunity is available: the option to farm in to a prospect in South Country waters. Even in the absence of other geological data, we would be unwise to apply the historical success rate as the expected Pg of this prospect, on the basis that the prospects with highest Pg in the block have probably already been drilled. Our estimated Pg for this farm-in opportunity should be significantly lower than the historic frequency, unless we can demonstrate that previous selection was made dominantly on the basis of prospect volume, not of risk.
CASE STUDY: CAMBODIA–THAILAND OVERLAPPING CLAIMS AREA
The Gulf of Thailand is a prolific petroleum province of Southeast Asia (Ridd et al., 2011). Exploration drilling has been largely confined to the Thai side of the border because of a long-standing territorial dispute between Thailand and Cambodia. Exploration success rate on the Thai side is reported to be about 40% (Polahan, 1986). The Pattani Basin (e.g., Bustina and Chonchawalita, 1995; Jardine, 1997) has proven particularly successful, and this basin straddles the boundary between Thai waters and a contested area known as the OCA (Overlapping Claims Area) in which little exploration activity has occurred (Figure 6). It is clear that the Pattani Basin continues into the OCA, but it is not clear from publicly available data how far it extends. This is a good example of a case where the historical success frequency in the Thai part of the basin is an appropriate guide to the expected Pg of prospects which may be identified in the OCA part of the basin; the prospects in the OCA have not been cherry picked; additionally, very little geological data are available on which to base an estimate of Pg in the OCA, so the past success frequency is the best method available to us. Therefore, as a starting point we could estimate the chance of success of a prospect in the OCA part of the Pattani Basin as 0.4. This estimate could be refined if we had access to more specific historical success data on the Pattani Basin or if geological or geophysical information were to become available specific to the OCA.
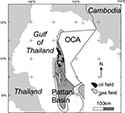 Figure 6. Location of the Overlapping Claims Area (OCA) in the northern Gulf of Thailand, which has remained essentially unexplored. The adjacent part of the Pattani Basin, which lies in Thai-controlled waters, has been extensively drilled. Map compiled from online sources including Committee for Coordination of Joint Prospecting for Mineral Resources in Asian Offshore Areas (CCOP) (2002) and KrisEnergy (2015).
CASE STUDY: THE WESTERN ATWATER FOLD BELT, GULF OF MEXICO
The lower Miocene anticline play of the Western Atwater fold belt (Figure 7) is a good test case because the results are well documented (e.g., Moore et al., 2001) because it contains a set of large structures that are well defined (e.g., Dias et al., 2010); all of these have now been tested with at least one well. The study area contains 10 large drilled structures. Four of these were successes at lower Miocene level, comprising major oil fields (Mad Dog, Atlantis, Shenzi, and Neptune); the rest of them were not success cases according to the predrill success case model. However, some of these found hydrocarbons at other stratigraphic levels or found dry gas in place of the oil prognosed in the success case model.
 Figure 7. Outline map of the frontal fold trend of the Western Atwater fold belt, Gulf of Mexico (gray area on main map), showing the major structural traps with their original prospect names, with outlines from Moore et al. (2001) and Dias et al. (2010). Geological success cases at lower Miocene level are shown in solid black (Neptune, Atlantis, Mad Dog, and Shenzi oil fields); failure cases at lower Miocene level are shown in white. Note that some of these failure cases encountered oil at different stratigraphic levels or encountered dry gas in place of prognosed oil. Small squares are US Bureau of Ocean Energy Management Outer Continental Shelf lease blocks.
Figure 8 shows the sequence of results of the first well on each structure and the chance of success that we would predict for the next well if historical data were the only information available to us. Initially, a major difference exists between historical success rate (gray curve) and the go-forward Pg predicted using the rule of succession (black curve). As more wells are drilled and the sample size increases, the difference diminishes to near-negligible levels.
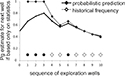 Figure 8. Sequence of drilling results for the first well testing a structure in lower Miocene play of the Western Atwater fold belt, showing a comparison of a prediction of the chance of success (Pg) of the next well, based on unmodified past frequency (open diamonds and gray line) compared with the probabilistic prediction using the rule of succession (black diamonds and black line). Black circles indicate geological success, and dry hole symbols (open circles with crosses) indicate that predrill geological model was not a success; note that some of these failure cases encountered hydrocarbons at other stratigraphic levels (e.g., Puma) or encountered dry gas in place of the prognosed oil (e.g., Frampton).
At the end of the sequence of drilling 10 prospects, both methods have converged on a go-forward prediction of Pg = 0.4, but is this representative of what we might expect on a go-forward basis? In other words, would this be an appropriate Pg to use for the next prospect? On the basis of publicly available maps (e.g., Dias et al., 2010), we can say that this is definitely not the case, because all the obvious major anticlinal structures (the “big bumps”) within this footprint have been drilled. Any new prospect in the same play would not look like the existing success versus failure data set, which tests all the major anticlinal closures (in contrast, any new prospect in the same general play would have to be deep or subtle or have low relief closure).
Therefore, if we do not have access to any geological evidence to the contrary, we would expect any new prospect defined in the same play to have a different (and probably significantly lower) chance of success, not represented by the existing historic data. This is a good example where past statistics are not a good guide to future performance.
SENSE CHECK
So far we have set out how to obtain the most appropriate estimate of Pg based only on the local success versus failure statistics within the same play as the undrilled prospect.
However, it would be a mistake to only take local success versus failure data within the play into consideration; our judgment should also take into consideration all relevant data from around the globe. This may be particularly important if our local data are not compelling (e.g., it is sparse or of questionable reliability or relevance) but we have a good global data set that informs our judgment.
Clearly, if the local data are abundant and of high relevance to our prospect, our estimate of the chance of success should be dominantly based on those local data, but we need a method for constraining the local estimate with global data. Figure 9 shows a simple nomogram method that could facilitate this task.
 Figure 9. A simple nomogram approach to moderate a statistical prediction based on limited data. An estimate is made based on global data alone (a), such as the global frequency of stratigraphic trap success, adapted from Binns (2006), and a second estimate is made using only local data (b). The user makes a judgment as to the relative quality of the local data set (c), and the intersection gives an appropriate modified estimate (d).
The upper part of the plot is a cross-plot of the apparent frequency (or apparent chance) of success (on the x axis) against the quality of the local data (on the y axis). The frequency of success from global data (point a) and the predicted chance of success from local data alone (point b) are posted at the top and bottom of this chart. We make a judgment of the quality of the local data, relative to the global data (point c). The intersection with line a–b gives a sense-checked estimate of the local chance of success (point d), so that if the local data are strong (abundant and high quality), the prediction will be close to the local data, but if the local data are weak (sparse and poor quality), the prediction will fall closer to the global value.
As an example, we can consider the chance of success of the lateral trapping component of a prospect that is a stratigraphic trap. This notional example includes only two local tests in the play, both successful; using the method set out previously, we would predict a chance of success (point b in Figure 9) from these statistics of 0.75. We would, however, be concerned that this estimate was based on a very small sample.
If we consult a global data set describing the success rates of stratigraphic traps using a much larger data set (e.g., Binns, 2006), we might discover that the global success rate for the type of trap edge seen in our prospect is only 0.2.
We would then make a judgement of the relative quality of the local versus the global data (point c in Figure 9), and in this example, we might judge that the sense-checked chance of success (point d) should fall in the range 0.35 to 0.4, significantly lower than the estimate we would obtain using only the local data.
This method may not be strictly correct, in that a rigorous combination of global data and local information may require Bayesian or other methods of computation, but we consider that it is an efficient method which should be appropriate for most prospects.
CONCLUSIONS
Past success versus failure frequency can provide a valuable tool for predicting future chance of success, but the raw frequency should be modified arithmetically to translate it into a prediction, particularly where the sample size is small or where it consists mostly (or entirely) of successes or failures.
The appropriate conversion can be simply calculated, and it is presented here as a table for values of n (sample size) up to 11. For larger sample sizes, the difference between simple past frequency and the calculated future chance is small, and although it would be advisable to use the corrected value, calculated using the rule of succession, the difference (<0.05) probably falls within an acceptable margin of error.
Past performance statistics may be used as a guide for predicting the chance of success of the prospect as a whole (Pg) or the chance of success of an individual component of prospect risk.
Past success versus failure statistics may provide a valid method for estimating future Pg if the data set consists of samples that we believe are analogous to the undrilled prospects and if they do not come from a pool of opportunities that has been selectively cherry picked by the well tests. Common scenarios in which such conditions may apply include the new release of acreage that has previously been undrillable (for technical or political reasons) adjacent to acreage from which the sample is taken.
Appendix: Method Used to Calculate Table 1
The chance that an event of probability Pg will deliver s successes out of n trials is given by the general binomial probability formula, as derived by Isaac Newton: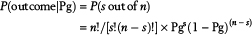
For each value of n and s in Table 1, the mean value of Pg that gives rise to the observed outcome was calculated as shown in Figure 10, by dividing the area under the curve Pg × P(outcome|Pg) by the area under the curve P(outcome|Pg). The results obtained by this graphical method are equivalent to those calculated using the rule of succession.
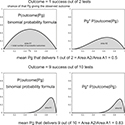 Figure 10. Basis of calculation of the table of predicted chance of geological success of a prospect (Pg) from past success versus failure frequency data.
REFERENCES CITED
Alexander, J. A., and J. R. Lohr, 1998, Risk analysis: Lessons learned: Society of Petroleum Engineers Annual Meeting, New Orleans, Louisiana, September 27–30, 1998, SPE-49030-MS, 10 p., doi:10.2118/49030-MS.
Allais, M., 1956, Évaluation des perspectives économiques de la recherche minière sur de grands espaces—Application au Sahara Algérien, Revue de l’Industrie Minérale: Paris, Société de l'Industrie Minérale, p. 329–383.
Baddeley, M. C., A. Curtis, and R. Wood, 2004, An introduction to prior information derived from probabilistic judgements: Elicitation of knowledge, cognitive bias and herding, in Curtis, A., and R. Wood, eds., Geological prior information: Informing science and engineering: Geological Society, London, Special Publications 2004, vol. 239, p. 15–27, doi:10.1144/GSL.SP.2004.239.01.02.
Bayes, T., 1763, An essay toward solving a problem in the doctrine of chances: Philosophical Transactions of the Royal Society of London, v. 53, p. 370–418, doi:10.1098/rstl.1763.0053.
Binns, P. E., 2006, Evaluating subtle stratigraphic traps, prospect to portfolio, in Allen, M. R., G. P. Goffey, R. K. Morgan, and I. M. Walker, eds., The deliberate search for the stratigraphic trap: Geological Society, London, Special Publications 2006, . vol 254, p. 7–26, doi:10.1144/GSL.SP.2006.254.01.02.
Bustin, R. M., and A. Chonchawalita, 1995, Formation and tectonic evolution of the Pattani Basin, Gulf of Thailand: International Geology Review, v. 37, no. 10, p. 866–892, doi:10.1080/00206819509465431.
Capen, E. C., 1992, Dealing with exploration uncertainties, in Steinmetz, R., ed., The business of petroleum exploration: AAPG treatise of petroleum geology, handbook of petroleum geology, p. 29–61.
Committee for Coordination of Joint Prospecting for Mineral Resources in Asian Offshore Areas (CCOP), 2002, Thailand petroleum geology and potential, accessed November 11, 2015, http://www.ccop.or.th/epf/thailand/thailand_petroleum.html.
Dias, T. A., D. L. Tett, and M. T. Croasdaile, 2010, Evidence for a hydrodynamic aquifer in the lower Miocene sands of the Mad Dog Field, Gulf of Mexico: AAPG Search and Discovery article 10221, accessed November 11, 2015, http://www.searchanddiscovery.com/documents/2010/10221dias/.
Forrest, M., R. Roden, and R. Holeywell, 2010, Risking seismic amplitude anomaly prospects based on database trends: Leading Edge, v. 29, p. 570–574, doi:10.1190/1.3422455.
Fosvold, L., M. Thomsen, M. Brown, L. Kullerud, N. Ofstad, and K. Heggland, 2000, Volumes before and after exploration drilling: results from the project: Evaluation of Norwegian wildcat wells (Article 2), in Ofstad, K., J. E. Kittilsen, and P. Alexander-Marrack, eds., Improving the exploration process by learning from the past: Haugesund, Norway, Norwegian Petroleum Society Special Publication 9, p. 33–46.
Harper, F. G., 2000, Prediction accuracy in petroleum prospect assessment: A 15 year retrospective in BP, in Ofstad, K., J. E. Kittilsen, and P. Alexander-Marrack, eds., Improving the exploration process by learning from the past: Haugesund, Norway, Norwegian Petroleum Society Special Publication 9, p. 15–21.
Hogarth, R. M., 1978, A note on aggregating opinions: Organizational Behavior and Human Performance, v. 21, p. 40–46, doi:10.1016/0030-5073(78)90037-5.
Hora, S. C., 2007, Eliciting probabilities from experts, in Edwards, W., R. F. Miles, and D. von Winterfield, eds., Advances in decision analysis: From foundations to applications: Cambridge, United Kingdom, Cambridge University Press, p. 129–153, doi:10.1017/CBO9780511611308.009.
Jardine, E., 1997, Dual petroleum systems governing the prolific Pattani Basin offshore Thailand, in Proceedings of the Petroleum Systems of SE Asia and Australasia Conference: Jakarta, Indonesian Petroleum Association, p. 351–363.
Kent, S., 1964, Words of estimative probability, in Steurey, D. P., ed., Sherman Kent and the Board of National Estimates: Collected essays: Washington, DC, Center for the Study of Intelligence, accessed November 11, 2015, https://www.cia.gov/library/center-for-the-study-of-intelligence/csi-publications/books-and-monographs/sherman-kent-and-the-board-of-national-estimates-collected-essays.
KrisEnergy, 2015, Thailand (B8/32 & B9A), accessed November 11, 2015, https://www.krisenergy.com/operations/#thailand.
Laplace, P.-S., 1774, Mémoire sur la probabilité des causes par les événements: Mémoires de l’Académie Royale des Sciences de Paris, v. VI, p. 621–656.
Megill, R. E., 1977, An introduction to exploration risk analysis: Tulsa, Oklahoma, PennWell, 273 p.
Moore, M. G., G. M. Apps, and F. J. Peel, 2001, The petroleum system of the western Atwater foldbelt in the ultra deep water Gulf of Mexico: 21st Annual Bob F. Perkins Research Conference, December 2–5, Houston, Texas, Gulf Coast Section Society of SEPM Foundation, doi:10.5724/gcs.01.21.0369.
Newendorp, P. D., 1972, Bayesian analysis—A method for updating risk estimates: Journal of Petroleum Technology, v. 24, p. 193–198, doi:10.2118/3463-PA.
Ofstad, K., E.-J. Kittilsen, and P. Alexander-Marrack, eds., 2000a, Improving the exploration process by learning from the past: Haugesund, Norway, Norwegian Petroleum Society Special Publication 9, 288 p.
Ofstad, K., L. Kullerud, and D. Helliksen, 2000b, Evaluation of Norwegian wildcat wells (Article 1), in Ofstad, K., J. E. Kittilsen, and P. Alexander-Marrack, eds., Improving the exploration process by learning from the past: Haugesund, Norway, Norwegian Petroleum Society Special Publication 9, p. 23–31.
Ofstad, K., A. Øvretveit, L. Kullerud, and K. Heggland, 2000c, Probability of discovery and the reasons for dry wells: results from the project: Evaluation of Norwegian wildcat wells (Article 3), in Ofstad, K., J. E. Kittilsen, and P. Alexander-Marrack, eds., Improving the exploration process by learning from the past: Haugesund, Norway, Norwegian Petroleum Society Special Publication 9, p. 47–55.
Peel, F. J., and J. R. V. Brooks, 2015, What to expect when you’re prospecting: How new information changes our estimate of the chance of success of a prospect: AAPG Bulletin, v. 99, p. 2159–2171, doi:10.1306/070615045.
Peel, F. J., and J. White, 2015, Do technical studies reduce subsurface risk in hydrocarbon exploration - and if not, how do they add value? in Bowman, M., H. R. Smyth, T. R. Good, S. R. Passey, J. P. P. Hirst, and C. J. Jordan, eds., The value of outcrop studies in reducing subsurface uncertainty and risk in hydrocarbon exploration and production: Geological Society, London, Special Publications 2015, vol. 436, doi:10.1144/SP436.4.
Polahan, P., 1986, Oil potential in the Gulf of Thailand: Offshore Technology Conference, Houston, Texas, May 5–8, 1986, OTC-5179-MS, 5 p., doi:10.4043/5179-MS.
Ridd, M. F., A. J. Barber, and M. J. Crow, 2011, The geology of Thailand: Geological Society, London, 640 p.
Rose, P. R., 1987, Dealing with risk and uncertainty in exploration: How can we improve?: AAPG Bulletin, v. 71, no. 1, p. 1–16.
Rose, P. R., 1992, Chance of success and its use in petroleum exploration, in Steinmetz, R., ed., The business of petroleum exploration: AAPG treatise of petroleum geology, handbook of petroleum geology, p. 71–86.
Rose, P. R., 2001, Risk analysis and management of petroleum exploration ventures: AAPG Methods in Exploration 12, 178 p.
Securities and Exchange Commission, 2008, Invest wisely: An introduction to mutual funds, accessed July 2, 2008, http://sec.gov/investor/pubs/inwsmf.htm.
Surowiecki, J., 2004, The wisdom of crowds: Why the many are smarter than the few and how collective wisdom shapes business, economies, societies, and nations: New York, Doubleday, 296 p.
White, D. A., 1993, Geologic risking guide for prospects and plays: AAPG Bulletin, v. 77, p. 2048–2064.
AUTHORS
Frank Peel received his doctorate from the University of Oxford. He was a structural geologist and senior technical advisor at BP and BHP from 1985 to 2013. He joined the National Oceanography Centre in 2013; research interests include salt tectonics, gravity-driven deformation, fluid flow, and exploration risk. He is a recipient of the Matson Award of AAPG.
John Brooks received his doctorate from the University of Kingston. As director of exploration and licensing of the UK DoE, he was responsible for regulating UK petroleum licensing rounds. His company, Brookwood Petroleum, provides advice to international governments establishing petroleum licensing rounds, and as senior visiting research fellow, he mentors students at Southampton. He is past president, European Region AAPG.
ACKNOWLEDGMENTS
The authors gratefully acknowledge support for Frank Peel by the UK NERC (Natural Environment Research Council) through National Capability funding. The authors are grateful to our reviewers (William Hill, Gary Prost, and Dale Leckie) and to consulting editor Frances Plants Whitehurst for constructive suggestions that greatly improved the article.