The AAPG/Datapages Combined Publications Database
AAPG Bulletin
Full Text
![]() Click to view page images in PDF format.
Click to view page images in PDF format.
AAPG Bulletin, V.
DOI: 10.1306/12111514206
Hydrogen sulfide formation, fate, and behavior in anhydrite-sealed carbonate gas reservoirs: A three-dimensional reactive mass transport modeling approach
Yunjiao Fu,1 Wolfgang van Berk,2 and Hans-Martin Schulz3
1Section 4.3: Organic Geochemistry, Helmholtz Centre Potsdam GFZ German Research Centre for Geosciences, Telegrafenberg, D-14473 Potsdam, Germany; [email protected]
2Institute for Disposal Research, Clausthal University of Technology, Leibnizstraße 10, D-38678 Clausthal-Zellerfeld, Germany; [email protected]
3Section 4.3: Organic Geochemistry, Helmholtz Centre Potsdam GFZ German Research Centre for Geosciences, Telegrafenberg, D-14473 Potsdam, Germany; [email protected]
ABSTRACT
A novel hydrogeochemical modeling approach is developed to unravel thermochemical sulfate reduction (TSR) in hydrocarbon reservoirs. Our numerical model couples a web of interconnected hydrogeochemical reactions to three-dimensional (3-D) and reservoir-wide diffusive mass transport. Our modeling approach simulates a semigeneric gas reservoir sealed by anhydrite. The calculated diagenetic processes fit the observations in reservoirs affected by TSR: formation of water, precipitation of calcite, metal (di-)sulfides, and elemental sulfur as replacements of dissolved anhydrite at the expense of CH4(g), as well as formation of hydrogen sulfide (H2S). By varying input parameters, the crucial factors controlling TSR have been identified. Our results highlight that reservoir-wide diffusive mass transport is one prerequisite for TSR. An increase in the rate constant of abiotic sulfate reduction (ASR) and in diffusive mass fluxes, as well as lack of precursor minerals for metal (di-)sulfide precipitation, can increase the souring intensity and accelerate H2S outgassing. In contrast, precipitation of elemental sulfur, which is stable according to the chemical thermodynamics, weakens H2S formation. Our modeling shows that TSR is complex and cannot be represented by the single reaction ASR and by simple correlations between the rate constant of ASR and the H2S gas content. The application of 3-D reactive transport modeling presented here, despite its semigeneric nature, provides a good example of how such an approach can be used ahead of drilling. Our modeling helps to investigate TSR in time and space to quantify the mass conversion of all reactants involved within this web and to predict the souring level.
BACKGROUND AND AIMS
Hydrogen sulfide (H2S) is toxic and corrosive and lowers gas and oil value. Many studies have demonstrated that thermochemical sulfate reduction (TSR) is one of the most important mechanisms responsible for the substantial quantities of H2S observed in many petroleum reservoirs deeply buried (Nöth, 1997; Machel 2001; Cross et al., 2004). Future production from deeper reservoirs exposed to higher temperature and pressure conditions will face more aggressive corrosion environments and will inevitably increase risks and costs resulting from reservoir souring by H2S; TSR evolves as a web of interlocked processes. In addition to reservoir souring by H2S, TSR induces strong alterations of reservoir rocks and, consequently, changes in porosity and permeability under high-temperature conditions of more than ∼100°C (212°F) (Nöth, 1997; Machel, 2001). The temporal and spatial evolution of H2S formation, fate, and behavior, as well as the alteration of reservoir rock properties all triggered by TSR, are of great relevance for petroleum reservoirs. Therefore, several previous studies investigated TSR and its consequences from various perspectives.
Several publications aiming at studying TSR and its interrelated diagenetic processes are based on petrographic and geochemical data, on gas composition, and on stable isotope ratios of gas compounds or of formation water in reservoirs that were strongly affected by TSR, for instance, in the Khuff Formation of Abu Dhabi, United Arab Emirates (e.g., Videtich, 1994; Worden and Smalley, 1996; Worden et al., 1996). Bacteria-mediated sulfate reduction is geologically instantaneous (Machel, 2001). In contrast, high-temperature sulfate reduction by petroleum-derived reductants is an abiotic, kinetically controlled process with a relatively low rate but with a strong mass conversion at the geological time scale (Machel, 2001). Several studies used laboratory experiments to determine the kinetic rate of abiotic sulfate reduction (ASR) by typical aqueous petroleum components at elevated temperatures to extrapolate this rate back to realistic reservoir conditions (e.g., Cross et al., 2004; Yue et al., 2006). However, these studies actually focused only on the chemical reaction between sulfate ions and petroleum components dissolved in aqueous solutions. This abiotic reduction reaction is defined as ASR in our study. Compared with ASR, the term TSR in our study refers to a web that couples petroleum–water–rock–gas reactions triggered by kinetically controlled ASR with diffusive mass transport (Figure 1). This term includes one kinetic reaction—ASR at elevated temperatures—and other hydrogeochemical equilibrium reactions that are induced by ASR, such as anhydrite dissolution, and formation of calcite and gaseous H2S (H2S(g)) (Figure 1).
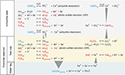 Figure 1. Selected reactions (from 60 reactions, in total) and processes coupled to thermochemical sulfate reduction (TSR) in a gas reservoir. Single arrow = time-dependent, kinetic-controlled reactions; double arrow = equilibrium reactions; gray triangles = time-dependent diffusive transport of aqueous components selected; blue = reactants of TSR; and red = products of TSR.
Besides temperature, several other factors could affect the activation energy of sulfate reduction by aqueous hydrocarbon components, lower the onset temperature of ASR, and increase the reactivity of aqueous species (see section titled Kinetic Aspects of Abiotic Sulfate Reduction). Reservoir wettability, which has been almost ignored in TSR studies, may have profound effects on both the onset temperature and the kinetic rate of ASR (Machel, 2001). Mougin et al. (2007) calculated the minimized Gibbs energy for a chemical system composed of hydrocarbons, anhydrite, liquid elemental sulfur, and water. Their results reveal that ASR can be regarded as an irreversible thermodynamic process ranging from 20°C to 240°C (68°F to 464°F). Bildstein et al. (2001) presented a shrinking core batch model to simulate TSR at the surface of anhydrite nodules. At the grain scale, anhydrite continues to dissolve when sulfate ions near the anhydrite surface are transported by diffusion to the site of TSR and when they are consumed by the redox reaction with hydrocarbons. Accordingly, the mass conversion of anhydrite dissolution is also time dependent. Thus, Bildstein et al. (2001) characterized anhydrite dissolution with a rate that is controlled by diffusion. Their results suggest that the overall TSR rate (at the centimeter scale around the anhydrite nodules) also depends on this rate in addition to the rate of the redox reaction between aqueous sulfate and petroleum species. Based on their approach at a small scale, Bildstein et al. (2001) hypothesized that the TSR reaction zone at the reservoir scale may be restricted to the sectors where the reactants of TSR are simultaneously present. Therefore, reactive mass transport modeling is the prerequisite for correctly investigating TSR and its consequences at the reservoir scale.
The study presented here describes the development of a three-dimensional (3-D) hydrogeochemical reactive mass transport (HRMT) model for simulating chemical reactions resulting from TSR at the reservoir scale. The generation of H2S resulting from secondary cracking of oil is excluded from our study. Our model is based on the thermodynamics of chemical equilibrium of water–rock–gas interactions, except for sulfate reduction by aqueous hydrocarbons, which is considered as an irreversible, kinetically controlled reaction. It is not our aim to reproduce TSR in a real petroleum reservoir. Our study considers a semigeneric dolomite reservoir under initial conditions that are clearly defined. We therefore aim to investigate the basic mechanisms of TSR in an integrated way over geological times at the reservoir scale with regard to various aspects: (1) qualitatively, i.e., which minerals dissolve or newly form because of TSR; (2) quantitatively, i.e., which factors control the concentration of H2S in a multicomponent gas and the overall TSR rate (approximately quantified by the maximum amount of dissolved anhydrite during a given time span); (3) temporally, i.e., which factors affect the temporal development of H2S gas formation; and (4) spatially, i.e., where is the TSR hot spot in a reservoir?
REVIEW OF THERMOCHEMICAL SULFATE REDUCTION
In petroleum systems, TSR is a complex process that is controlled by the interplay of burial history, hydrocarbon filling history, reservoir mineralogy, formation water composition, and types of accumulated hydrocarbons. Although the typical products of TSR have been observed in geological settings with a temperature higher than 100°C (212°F), the actual onset temperature of ASR is still a matter of debate (Machel, 2001). In the temperature range of 100°C−140°C (212°F–284°F), ASR may be activated because the minimum temperature of ASR is governed by several factors (Machel, 2001). Petroleum-derived organic components (e.g., aqueous n-alkanes) act as the electron donors for ASR and react with acid- and redox-buffering minerals in reservoir rocks and in the sealing anhydrite to finally generate H2S via sulfate reduction. These thereby triggered and interconnected hydrogeochemical reactions among aqueous, solid, and gaseous species lead to a compositional alteration of the reservoir rock mineral assemblage and the coexisting hydrocarbon-dominated gas. Such an alteration could cause a deterioration of reservoir properties besides petroleum souring by H2S.
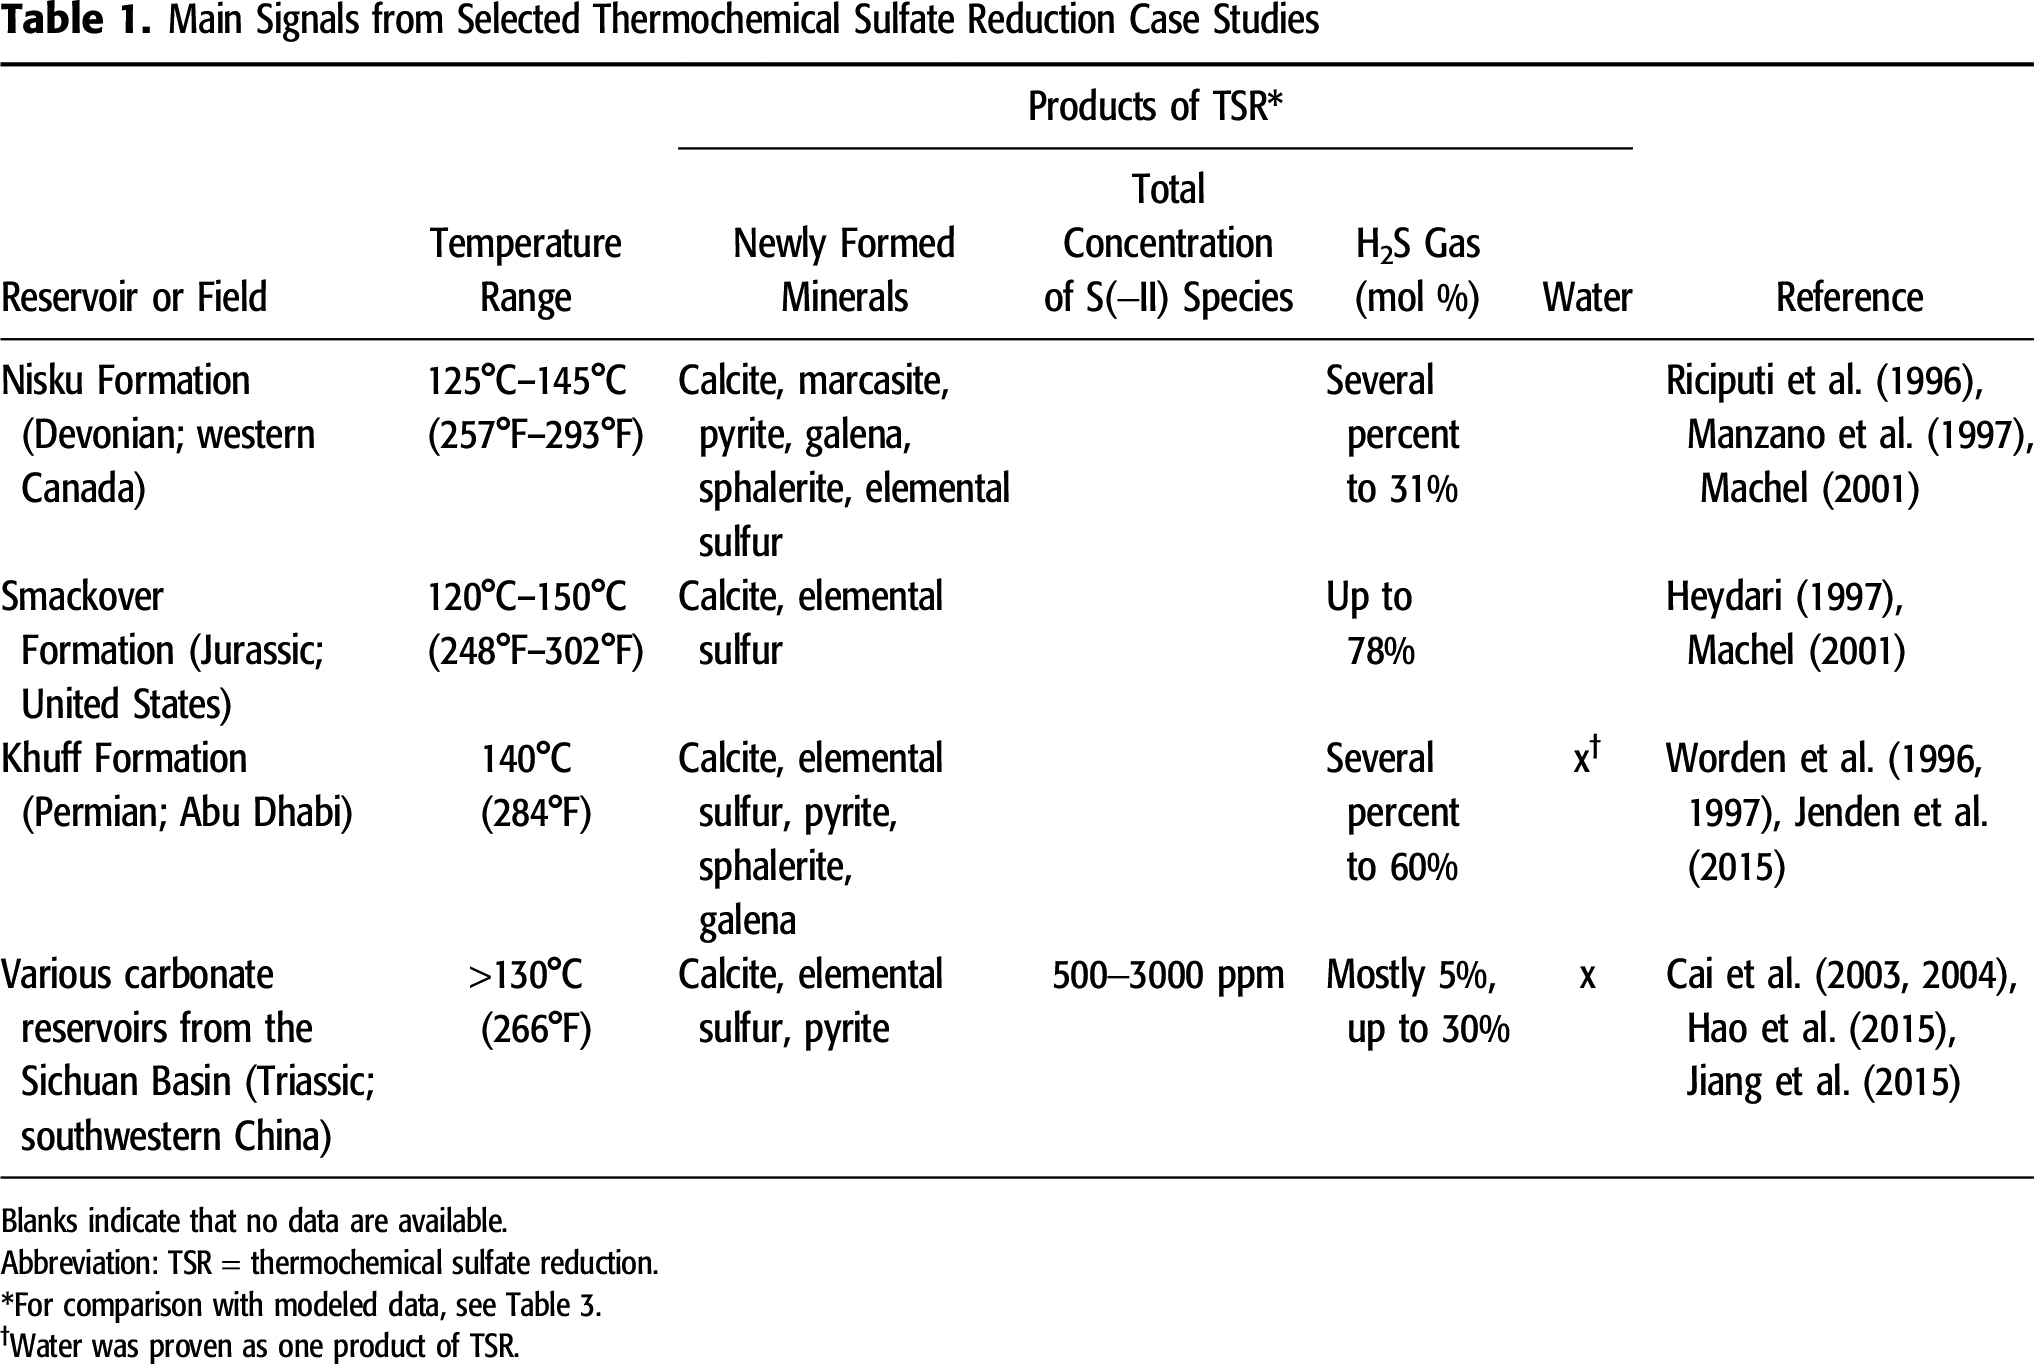
Complex Web of Reactions Contributing to Thermochemical Sulfate Reduction
The kinetically controlled sulfate reduction by aqueous n-alkanes triggers further hydrogeochemical reactions (Figure 1) to establish a thermodynamically defined state of chemical equilibrium (Helgeson et al., 1993; Seewald, 2003; Mougin et al., 2007; van Berk et al., 2009, 2013). Regarding the thermodynamic stability of the components involved in TSR, the results calculated by Mougin et al. (2007) are consistent with the main observations in reservoirs undergoing TSR, for example, Nisku Formation, Khuff Formation, Smackover Formation, and Sichuan Basin (Table 1). Consumption of anhydrite and hydrocarbons simultaneously occurs with new formation of elemental sulfur (S(0)) and calcite. Additionally, metal sulfides or disulfides (e.g., marcasite, pyrite, sphalerite, and galena) can form because of TSR (Table 1). As a result of mineral precipitation, TSR could lead to changes in porosity and consequently in permeability (Nöth, 1997). Investigations on core samples taken from the Feixianguan Formation located in the Sichuan Basin show that the reservoir rocks suffered porosity loss, which results from bitumen generation and precipitation of calcite and pyrite induced by TSR (Hao et al., 2015). As another reduced sulfur form, H2S is distributed within the whole system as an aqueous species (H2S(aq)) or as an important component of the coexisting gas (H2S(g)). The concentration of aqueous S(−II) species (S(−II)(aq)) in formation water may reach up to 3 g kgw−1 (Table 1), and the total concentration of dissolved sulfur species (S(−II) + sulfate) may increase up to approximately 0.51 mol L−1 (at a temperature <200°C [392°F]) in sour petroleum systems (Goldhaber and Orr, 1995). The H2S content in the gas phase significantly varies over a broad range from several percent to 78 mol % (Table 1). The extremely high H2S amount in the gas indicates that H2S in sour gas reservoirs may have more than one origin, for example, thermal cracking of liquid hydrocarbon in the Smackover Formation (Heydari, 1997). Several studies used one chemical reaction related to ASR and suggested water as a by-product of TSR (e.g., Mougin et al., 2007). However, water formation resulting from TSR was not commonly proven except for a few case studies that provided clear evidence of water formation with measurable amounts (the Khuff Formation, a Devonian sour gas reservoir [nonspecified], and the Feixianguan Formation from the Sichuan Basin) (Machel, 2001; Jiang et al. 2015) (Table 1).
Further geochemical reactions are also induced by ASR in the TSR web, although no sulfur is involved in several of them (Figure 1). It drives anhydrite dissolution and oxidizes petroleum components to carbonate carbon species (H2CO3(aq), HCO3−(aq), and CO32−(aq); Figure 1). This increases the activity of free Ca2+(aq) and CO32−(aq) ions and could consequently result in calcite precipitation. This process has been observed in sour petroleum reservoirs, such as the Khuff Formation, where anhydrite nodules altered to calcite at their margins (Worden et al., 1996). The pH and redox conditions governed by the total mass conversion of all interconnected reactions within the TSR web adjust the species distribution of sulfur. In other words, these conditions determine whether elemental sulfur S(0), metal sulfides, or disulfides are precipitated and whether H2S becomes a free gas component under specific temperature and pressure conditions. Primary minerals containing metal cations are the precursors for metal (di-)sulfides that possibly form.
Kinetic Aspects of Abiotic Sulfate Reduction
The TSR proceeds very slowly, and typical sour gas reservoirs may have formed during a time span from 10 k.y. up to 10 m.y. (Goldhaber and Orr, 1995; Machel, 2001). High-temperature ASR is a sluggish reaction caused by high activation energy barriers (Seewald, 2003; Yue et al., 2006). Reservoir temperature is commonly regarded as one of the most important factors for ASR. It affects the kinetic rate, whereas ASR may even be inhibited at temperatures lower than 100°C (212°F) (Machel, 2001). The experimental results show that an increasing temperature accelerates ASR (e.g., Cross et al., 2004; Yue et al., 2006). Because ASR is a complex process, other parameters are still matters of debate; ASR was suggested as a first-order kinetic reaction (e.g., Cross et al., 2004), although several experimental results point to a zero-order reaction (e.g., Yue et al., 2006). Besides temperature, the kinetic rate of ASR depends on many factors. One of them is the hydrocarbon type, which can even affect the onset temperature (Zhang et al., 2007). Mougin et al. (2007) stated that saturated hydrocarbons with higher molecular weights have more thermodynamical preference to be involved in ASR and TSR. Their statement agrees well with the findings from Yue et al. (2006) that ASR with C3H8(aq) needs a lower activation energy compared with aqueous CH4 and C2H6. Sulfate reduction by C2H6 and C3H8 proceeds much faster with a half-life of approximately 106 and 105 yr, respectively, when compared with CH4 with a half-life in the order of magnitude of 108 yr (at 150°C [302°F]) (Yue et al., 2006). Laboratory experiments using acetic acid and acetate as the electron donor for ASR show that the half-life of sulfate ranges from 23 to 372,000 yr at 100°C–200°C (212°F–392°F) (Cross et al., 2004). The intermediates of oil degradation (e.g., alkanols and alkenone) (Seewald, 2003) by the stepwise oxidation of aqueous n-alkanes are also known as reductants for sulfate reduction (Zhang et al., 2007). A higher reactivity is shown by 1-octene, 1-octanol, and 1-octanone when compared with n-octane, octanoic acid, and xylene regarding ASR (Zhang et al., 2007).
The presence of labile organic sulfur compounds, S(0)(s or l), and H2S(g), as well as the partial pressure of H2S(g) (pH2S(g)) have significant effects on ASR (Amrani et al., 2008; Ma et al., 2008; Zhang et al., 2008). Different levels of pH2S(g) correspondingly characterize aqueous solutions with different pH caused by H2S gas dissolution and the subsequently coupled dissociation of H2S(aq) species to HS−(aq), S2−(aq), and H+(aq). Several experimental results suggested pH or HSO4− concentrations as two important factors controlling ASR (Zhang et al., 2008). However, Cross et al. (2004) stated that the ASR rate is independent of pH of formation water. Specific compositions of aqueous solutions (Tang et al., 2005) and MgSO40(aq) ion pairs (Ellis et al., 2006), which form via equilibrium reactions between free Mg2+ and SO42− ions, can also affect the kinetic rate of ASR. Although it was proven that the above-mentioned parameters (e.g., MgSO40(aq) ion pairs) accelerate ASR, such effects have not been quantified yet. Moreover, such experimental studies actually focused on each individual mechanism affecting ASR but not on the overall TSR rate or the release of H2S(g). Calcite precipitation on the surface of anhydrite nodules or grains can mitigate anhydrite dissolution and, thus, lower TSR mass conversion (Bildstein et al., 2001). Because TSR is a result of water–rock–gas reactions triggered by the kinetically controlled ASR and time-dependent diffusive mass transport, it is obvious that the kinetic rate of ASR is merely one of several factors affecting the total mass conversion of TSR at the reservoir scale. Moreover, sulfate reduction by hydrocarbons can proceed faster after its onset because an increase in H2S partial pressure, in temperature, and/or in the amount of reactants accelerates this reaction (Nöth, 1997).
Water as a Prerequisite for Thermochemical Sulfate Reduction
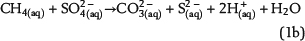
Free pore water in the water leg and irreducible water films surrounding mineral grains within the water-wet gas (or oil) column are the solvent for chemical species and provide the aqueous matrix for all chemical reactions. Therefore, water is one basic prerequisite for TSR. Consequently, the amount of available water can strongly limit the reaction progress and the mass conversion of TSR. Water is commonly expected as one of the important products of ASR based on one selected reaction of interest, which is similar to equation 1a (e.g., Machel, 2001; Ma et al., 2008). The ASR equations 1a–1e include both CH4(aq) and SO42−(aq) as the reactants but use different notations. These equations indicate that it is meaningless to use only one selected reaction to predict the fate and behavior of water during TSR (water generation in equations 1a and 1b; water consumption in equation 1d). Actually, these equations only reveal that H+ transfer is involved in the chemical reactions related to ASR. Thus, our model aims to reveal water generation or consumption under consideration of all potential reactions based on the thermodynamics of chemical equilibrium: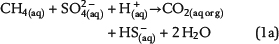
Sulfate ions as products of anhydrite dissolution are continuously consumed via ASR with petroleum-derived reductants according to distinct rate constants. Both sources for ASR—SO42−(aq) and aqueous n-alkanes or CH4(aq)—commonly occur in separated reservoir parts: the sealing anhydrite and the gas (or oil) column (Figure 1). When not present in sufficient concentrations, sulfate ions and aqueous hydrocarbons must be thus transported in aqueous solutions via diffusive mass transport to the reaction site. This indicates that water is an indispensable factor for TSR. Sulfate ions and hydrocarbons can react in the irreducible water of the gas cap, at the direct interface between the seal and the gas cap, and in lower seal layers. This is because ASR is controlled by kinetics, and both reactants are not completely consumed, if they co-occur. If water is a net product of TSR, this could support TSR by further dissolution of anhydrite in the seal. Consequently, it provides more dissolved sulfate ions for ASR. Moreover, water formation during TSR increases the water content in the seal and the gas cap and intensifies diffusion, which is dependent on water content. In contrast, diffusion and TSR will be decelerated or even stopped where water is completely consumed.
Similar to ASR, diffusive mass transport of aqueous components evolves as a time-dependent process at the reservoir scale, even within closed reservoir systems. Thus, both time-dependent processes—chemical ASR and diffusive mass transport—contribute to the overall TSR rate at the reservoir scale. Moreover, one might argue, similar to the continuous consumption of sulfate, that other time-dependent processes also affect the overall TSR rate, for instance, (1) consumption of Ca2+(aq) ions as the products of anhydrite dissolution by calcite precipitation and (2) supply with CO32−(aq) species to form calcite via diffusive mass transport. All these time-dependent processes are connected to each other and, in addition, are embedded into a web coupling reactions with diffusive mass transport (Figure 1). This web controls formation of reduced sulfur (S(−II)) and its in-reservoir fate and behavior. Thus, it is mandatory to consider all potential reactions and to couple them with mass transport processes to correctly reproduce the reservoir-wide evolution of TSR in time and space.
Diffusive mass transport connects the reactants of ASR from different reservoir parts and enables a long-term follow-up of ASR. The contact zone between the anhydrite seal and the gas cap (or the oil column) in a water-wet reservoir rock can therefore be seen as the hot spot for TSR at the reservoir scale because of short distances for diffusive mass transport. At a smaller scale, hot spots of TSR would also develop around anhydrite nodules, which can be distributed within the reservoir rock itself (Bildstein et al., 2001). In summary, water is one prerequisite for continuous and long-term TSR and is a process-dominating factor in the complex web contributing to reservoir souring by H2S. This is because (1) all chemical reactions proceed among aqueous components, (2) the mass transport of reactants proceeds via diffusive mass transport through aqueous solutions, and (3) the chemical composition of water controls how much sulfur released by anhydrite dissolution occurs as free H2S gas and as H2S dissolved in pore water under specific temperature and pressure conditions.
Previous Modeling Approaches
Because of the desirability to predict the H2S risk ahead of drilling, several studies attempted to geochemically model TSR. Peters et al. (2013, p. 1) presented an approach that “enables concentrations of Mg2+, Ca2+, and SO42− in pore water and sulfur in oil to be estimated based on reservoir lithology and oil quality.” Their calculated results about the H2S risk distribution were represented as areas where TSR can occur. This approach considers (1) “chemistry and thermal history of the reservoir,” (2) release of Ca2+ and SO42− from the anhydrite seal into oil, (3) catalytic effects of Mg2+ and H2S on sulfate reduction, and (4) (CH2) as organic compounds (equation 1e) (Peters et al., 2013, p. 1). Seemingly, the approach by Peters et al. (2013) considers oil as the solvent for ions involved in TSR; SO42−, Mg2+, and Ca2+ ions are available in the oil phase and are not sourced from pore water:
The modeling approach developed by Peters et al. (2013) defines TSR as oxidation of n-alkanes by SO42−(aq) to CO2 and H2S. Their model assumed that SO42−(aq) ions are being dissolved from the surrounding rock matrix into the oil phase. It seems that this model approach only focuses on the redox reaction between SO42−(aq) and a given electron donor. Moreover, their model ignores anhydrite dissolution as a basic process for the origin of sulfate for TSR and the subsequent reactions of sulfate based on the thermodynamics of chemical equilibrium. Bildstein et al. (2001) aimed to simulate diffusive mass transport of CH4(aq) to an anhydrite surface at a small scale. Because of the zero dimension of their modeling approach, they modified the kinetic rate of ASR to describe fluxes of CH4(aq) through a spherical unit surface of a reaction rim of anhydrite nodules. Their calculated results show that calcite precipitation on the anhydrite surface could strongly affect TSR processes at a small scale, which can be completed in 300,000 yr at 150°C (302°F). It is important to note that their model excludes intermediate sulfur species (e.g., S52−(aq) and S42−(aq)) and various complexes (e.g., CaSO40(aq) and CaHCO3+(aq)). Beyond that, Bildstein et al. (2001) considered dolomite as a chemically inactive matrix mineral, although MgSO40(aq) ion pairs have a strong influence on the ASR rate (Ellis et al., 2006). Dolomite can form or dissolve during TSR, and these processes lead to changes in pH–pE conditions, which have a profound effect on the H2S fate and behavior. Moreover, the small-scale model presented by Bildstein et al. (2001) suppresses formation of solid or liquid elemental sulfur (S(0)(s or l)), which was commonly observed in petroleum reservoirs influenced by TSR, such as in the Devonian Nisku Formation and the Smackover Formation (Table 1).
Any approach to geochemically and quantitatively model the TSR-induced H2S risk in petroleum systems should be based on a concept that adequately reproduces the interconnected and interdependent nature of all simultaneous hydrogeochemical reactions contributing to TSR (Figure 1). These water–rock–gas reactions should be coupled to simultaneous diffusive mass transport in a 3-D HRMT model because the occurrence of specific reactants of ASR is dependent on the lithology of individual reservoir parts. Thus, adequate modeling approaches should rely on (1) thermodynamic calculations of chemical equilibrium, (2) coupling of kinetically controlled reactions, and (3) calculations of diffusive mass transport through the free pore water network and the irreducible water film at the reservoir scale. Moreover, numerical TSR modeling must fulfill the fundamental laws of mass and charge conservation. Mass balance determines that exclusion of any potential sink for sulfur (e.g., formation of S(0) or metal disulfides) must lead to an overestimation of H2S risks. In summary, the key to model TSR, the fate and behavior of S(−II), and a realistic H2S risk for petroleum reservoirs is a comprehensive reproduction of the hydrogeochemical mass reactive transport processes that temporally and spatially evolve under reservoir conditions. Therefore, any model should not be restricted to selected reactions of interest that are isolated from the reaction web of TSR, i.e., not only restricted to ASR depending on the reservoir thermal history.
APPROACH TO SIMULATE HYDROGEN SULFIDE FORMATION AND BEHAVIOR IN A SEMIGENERIC GAS RESERVOIR
Our modeling approach is of a semigeneric nature. The aim of this study is not to simulate TSR in a real reservoir. In contrast, we attempt to integrate different aspects (see section titled Background and Aims) in a 3-D HRMT model to give insights about the temporal and spatial H2S risk distribution at the reservoir scale. Because of its semigeneric nature, our modeling considers simple but well-defined initial and boundary conditions, although these assumed conditions and parameter values are not a reflection of the complex geological reality. Nevertheless, this semigeneric model includes measured data, for instance, the kinetic rate of ASR gained in laboratory experiments. To verify the plausibility of our model, we compare our calculated results with the observations and the measured data from real sour gas reservoirs (summarized in Table 1). The US Geological Survey’s computer program PHAST (Parkhurst et al., 2010) is our 3-D HRMT modeling tool. It couples the geochemical computer program PHREEQC to the transport computer program HST3D (Parkhurst et al., 2010). Information about the computer programs PHAST and PHREEQC (e.g., the governing equations, their solver, and the structure of input files) are well documented in the manuals of PHAST and PHREEQC (for details, see Parkhurst et al., 2010; Parkhurst and Appelo, 2013). The thermodynamic wateq4f.dat database (Parkhurst and Appelo, 2013) is used to calculate the involved equilibrium reactions for aqueous species (49 reactions in total, listed in Table S5 [supplementary material available as AAPG Datashare 70 at www.aapg.org/datashare]). This database includes equilibrium constants (log K) for the standard temperature and pressure conditions and the temperature dependence of these equilibrium constants (by using the analytical expression or the reaction enthalpy based on the Van’t Hoff equation; for details, see the wateq4f.dat provided by Parkhurst and Appelo, 2013). The Model Viewer software (Hsieh and Winston, 2002) is applied to visualize the four-dimensional PHAST modeling results. To enable the reader to follow the next sections, Appendix 1 and Tables S.1–S.5 (supplementary material available as AAPG Datashare 70 at www.aapg.org/datashare) provide additional information about the modeling setup.
Geohydraulic Model Part
The semigeneric reservoir system is predefined for a 1000-m (3281-ft)-long, 2-m (7-ft)-wide, and 80-m (263-ft)-thick section (cell length, width, and height = 25, 1, and 1 m [82, 3, and 3 ft], respectively; Figure 2). Because ASR with different hydrocarbon types proceeds via the same mechanisms (but different kinetic rates), our study selects CH4(aq) as the electron donor for ASR and focuses on the reactions related to TSR within a dolomitic gas reservoir sealed by anhydrite. Accordingly, our simulated reservoir section is divided into an anhydrite seal, a gas cap, a gas–water transition (GWT) zone, and a water leg (Figure 2; for details, see Appendix 1, supplementary material available as AAPG Datashare 70 at www.aapg.org/datashare). Each reservoir part is generically defined by a homogenous spatial distribution of all geohydraulic and geochemical parameters that are assumed and preassigned for the pre-ASR conditions (Appendix 1 and Tables S.1–S.3, supplementary material available as AAPG Datashare 70 at www.aapg.org/datashare). Thus, discretization along width does not affect the calculated results in length and height. To shorten the program running time, the reservoir section is predefined by a width of 2 m (7 ft). Diffusive mass transport is the only transport process considered and enables an internal mass transport within the whole reservoir. Although hydraulic conductivity is predefined in the model input (Table S.1, supplementary material available as AAPG Datashare 70 at www.aapg.org/datashare), the reservoir is treated as a closed system without advective transport. Accordingly, the hydraulic conductivity and the dispersivity assumed in our study for different reservoir parts (see Table S.1) do not have any effects on the calculated results.
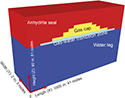 Figure 2. Scheme of the conceptual three-dimensional reservoir section.
For simulating diffusive mass fluxes, PHAST calculates the effective diffusion coefficient in rock matrices by multiplying diffusivity with tortuosity. Diffusivity represents the coefficient of molecular diffusion of aqueous species in dilute solutions without the presence of a porous matrix. Under given temperature and pressure conditions, diffusivity for different species slightly varies (e.g., at 25°C [77°F] and 1.0 atm [15 psi]; see Giambalvo et al., 2002). Generally, an increase in temperature results in higher diffusivity, whereas diffusivity decreases with increasing pressure (Oelkers and Helgeson, 1988). For the sake of simplicity, we used a diffusivity of 10−9 m2 s−1 for aqueous species involved in the TSR web under the simulated reservoir conditions of 140°C (284°F) and 600 atm (8818 psi). Tortuosity is a measure that describes the relation of effective diffusion mass fluxes in a porous medium to ideal diffusion mass fluxes in dilute solutions without the presence of any rock matrix. It ranges between 0 and 1. Our reference scenario 1–reference aims to consider the highest diffusion intensity. In this scenario, the water leg is characterized by an effective diffusion coefficient of 10−9 m2 s−1, whereas its tortuosity is specified by 1, although the tortuosity in porous media saturated by aqueous solutions must be lower than 1. Tortuosity depends on several properties of rock matrices, such as porosity, water saturation, grain size, grain size distribution, and cementation factor (e.g., Attia, 2005; Ewing et al., 2010). Direct measurements of tortuosity or of effective diffusion coefficient are very difficult in core samples. Thus, many studies developed empirical equations to describe the relation between tortuosity and its controlling factors (e.g., Attia, 2005; Shen and Chen, 2007; Ewing et al., 2010; Ghassemi and Pak, 2011). Such empirical equations could help us to get a rough estimate about the magnitude of tortuosity based on petrophysical rock properties. Because our study considers a semigeneric carbonate reservoir, we systematically varied the tortuosity of the water leg in four scenarios over four orders of magnitude from 1.0 to 0.0001 to cover a broad intensity range of diffusive mass transport (Table 2). The dolomitic reservoir rocks have a porosity of 10% compared with 1% in the seal, where pore space is occupied by irreducible water. The PHAST program is incapable of considering multiphase flow and only calculates reactive mass transport in porous systems saturated with water. Compared with free water in the water leg, the diffusion intensity must be much weaker through the gas–water emulsion in the GWT zone, through the irreducible water film in the gas cap, and through the seal. Thus, the tortuosity of these three reservoir parts is arbitrarily assumed to decrease by 50%, 10%, and 1% compared with the water leg (Table 2).
Typical gas souring of reservoirs mostly happens during a few million years (Goldhaber and Orr, 1995; Machel, 2001). The total modeling time span ranges up to 10 m.y. and is divided into 1000 time steps of 10 k.y. each. Despite this long modeled time span, it is assumed that the reservoir temperature and pressure conditions remain unchanged (140°C [284°F] and 600 atm [8818 psi]) for the sake of simplicity.
Hydrogeochemical Model Part
The presented modeling approach is based on the hypothetical TSR processes, which are described in the section titled Review of Thermochemical Sulfate Reduction. The reservoir rock matrix consists of calcite-bearing dolomite, which has an anhydrite seal containing 1.0 wt. % calcite (for details, see Appendix 1 and Table S.2 [supplementary material available as AAPG Datashare 70 at www.aapg.org/datashare]). Besides dolomite, calcite and goethite are considered as primary minerals in the dolomitic reservoir rocks (10 and 1 wt. %, respectively; Table S.2). ASR induces dissolution of primary minerals and drives chemical re-equilibration among water, minerals, and a multicomponent gas. Potential secondary minerals (S(0)(s)), siderite, and pyrite) and primary minerals (calcite, dolomite, and goethite; Table S.2) are allowed to precipitate at their saturation. Although S(0) is liquid at reservoir temperature higher than ∼150°C (302°F) (Bildstein et al., 2001), our model considers S(0)(s) as a potential secondary mineral because the chemical thermodynamic data of S(0)(l) are unavailable to us.
The gas initially filling the gas cap is dominated by CH4 (97 vol. %) and contains minor amounts of CO2 before the onset of ASR (3 vol. %; Table S.2, supplementary material available as AAPG Datashare 70 at www.aapg.org/datashare). Irreducible water is also present in the gas cap. It is assumed that the irreducible water contributes 1% to the total porosity of 10% in the gas cap. Correspondingly, 100 L of the bulk reservoir rocks in the gas cap contain 9 L of gas and 1 L of irreducible water, which reacts with minerals and gases. The initial composition of the pore water or the irreducible water in different reservoir parts before the onset of ASR is calculated by equilibrating 1 L of a 1.5 molal NaCl solution with the primary minerals and the gas phase (for details, see Appendix 1 and Table S.3 [supplementary material available as AAPG Datashare 70 at www.aapg.org/datashare]).
The database wateq4f.dat and PHAST are incapable of calculating the pressure dependence of equilibrium constants of the mass action laws for the minerals and gases as well as for species(aq) dissociation or association. Wesolowski et al. (2004) stated that many aqueous species reactions are insensitive to pressure changes at a constant temperature lower than 250°C. Thus, the pressure effects on aqueous species reactions remain unconsidered in our study. In contrast, calculations separated from the subsequent PHAST modeling are performed by using the computer program PHREEQC Interactive 3.1.4 and its database phreeqc.dat (Parkhurst and Appelo, 2013) to calculate the equilibrium constants for minerals and gases at the preassigned reservoir conditions of 140°C (284°F) and 600 atm (8818 psi) (e.g., anhydrite, calcite, and H2S(g); for details, see Table S.4, supplementary material available as AAPG Datashare 70 at www.aapg.org/datashare). Subsequently, these conditional equilibrium constants (listed in Table S.4) are redefined in the input file of the PHAST modeling. Based on these recalculated constants and the database wateq4f.dat, PHAST calculates all equilibrium reactions with consideration of diffusive mass transport according to the thermodynamics of chemical equilibrium, for example, anhydrite dissolution and formation of elemental sulfur (for details, see the manual of PHAST and PHREEQC; Parkhurst et al., 2010; Parkhurst and Appelo, 2013).
In addition to the above-mentioned equilibrium reactions (60 in total; for details, see Tables S.4 and S.5, supplementary material available as AAPG Datashare 70 at www.aapg.org/datashare), our model considers ASR as an irreversible, kinetically controlled reaction represented by equation 1b. Several parameters controlling ASR are still matters of debate (see section titled Kinetic Aspects of Abiotic Sulfate Reduction). It is not our aim to determine whether ASR is a zero- or first-order reaction. The reaction order of ASR does not change the pathway and the controlling factors of the subsequent hydrogeochemical processes (from calcite precipitation to H2S outgassing) induced by ASR. It just has effects on the absolute level of the mass conversion of TSR over a given time span, for example, the absolute amount of newly formed calcite and the absolute content of H2S(g). Thus, ASR with CH4(aq) is considered as a zero-order reaction in our study (according to Yue et al., 2006). However, the computer program PHAST also enables calculations of ASR as a first-order reaction.
Yue et al. (2006) determined the rate constant of 4.5 × 10⁻¹⁵ s−1 for equation 1b at 150°C (302°F). Compared with CH4(aq), ASR by saturated hydrocarbons with higher molecular weights proceeds with higher rates caused by a lowered activation energy (Yue et al., 2006; Mougin et al., 2007). Although the gas composition in the model is assumed to consist purely of CH4(g) and CO2(g) under the initial conditions, heavier saturated and gaseous hydrocarbons, such as C2H6 and C3H8, are also common gas components in real reservoirs filled with thermogenic gas. The MgSO4 and HSO4− ions, which form because of equilibrium reactions between SO42−(aq) and dolomite-derived Mg2+(aq) or H+(aq) in the model, can accelerate ASR (Ellis et al., 2006; Zhang et al., 2008). However, such effects on the ASR rate constant have been unquantifiable yet. Thus, scenario 1–reference considers an elevated rate constant of 4.5 × 10⁻¹² s−1 at 140°C (284°F) (Table 2) compared with 4.5 × 10⁻¹⁵ s−1 for ASR with pure methane as suggested by Yue et al. (2006). This increase aims to mimic the effects of C2H6 and C3H8 as additional reducing agents and of MgSO4(aq)0 and HSO4−(aq) as catalysts on ASR.
In summary, our modeling approach considers (1) the kinetically controlled ASR with CH4(aq) as a zero-order reaction, (2) 3-D diffusive mass transport of aqueous components through water (free pore and irreducible water), (3) 49 equilibrium reactions among aqueous species including temperature effects on these reactions, (4) 7 equilibrium reactions for mineral phases, (5) 4 equilibrium reactions among water and gaseous species, and (6) temperature and pressure effects on the equilibrium reactions for minerals and gases (for details, see Tables S.4 and S.5, supplementary material available as AAPG Datashare 70 at www.aapg.org/datashare).
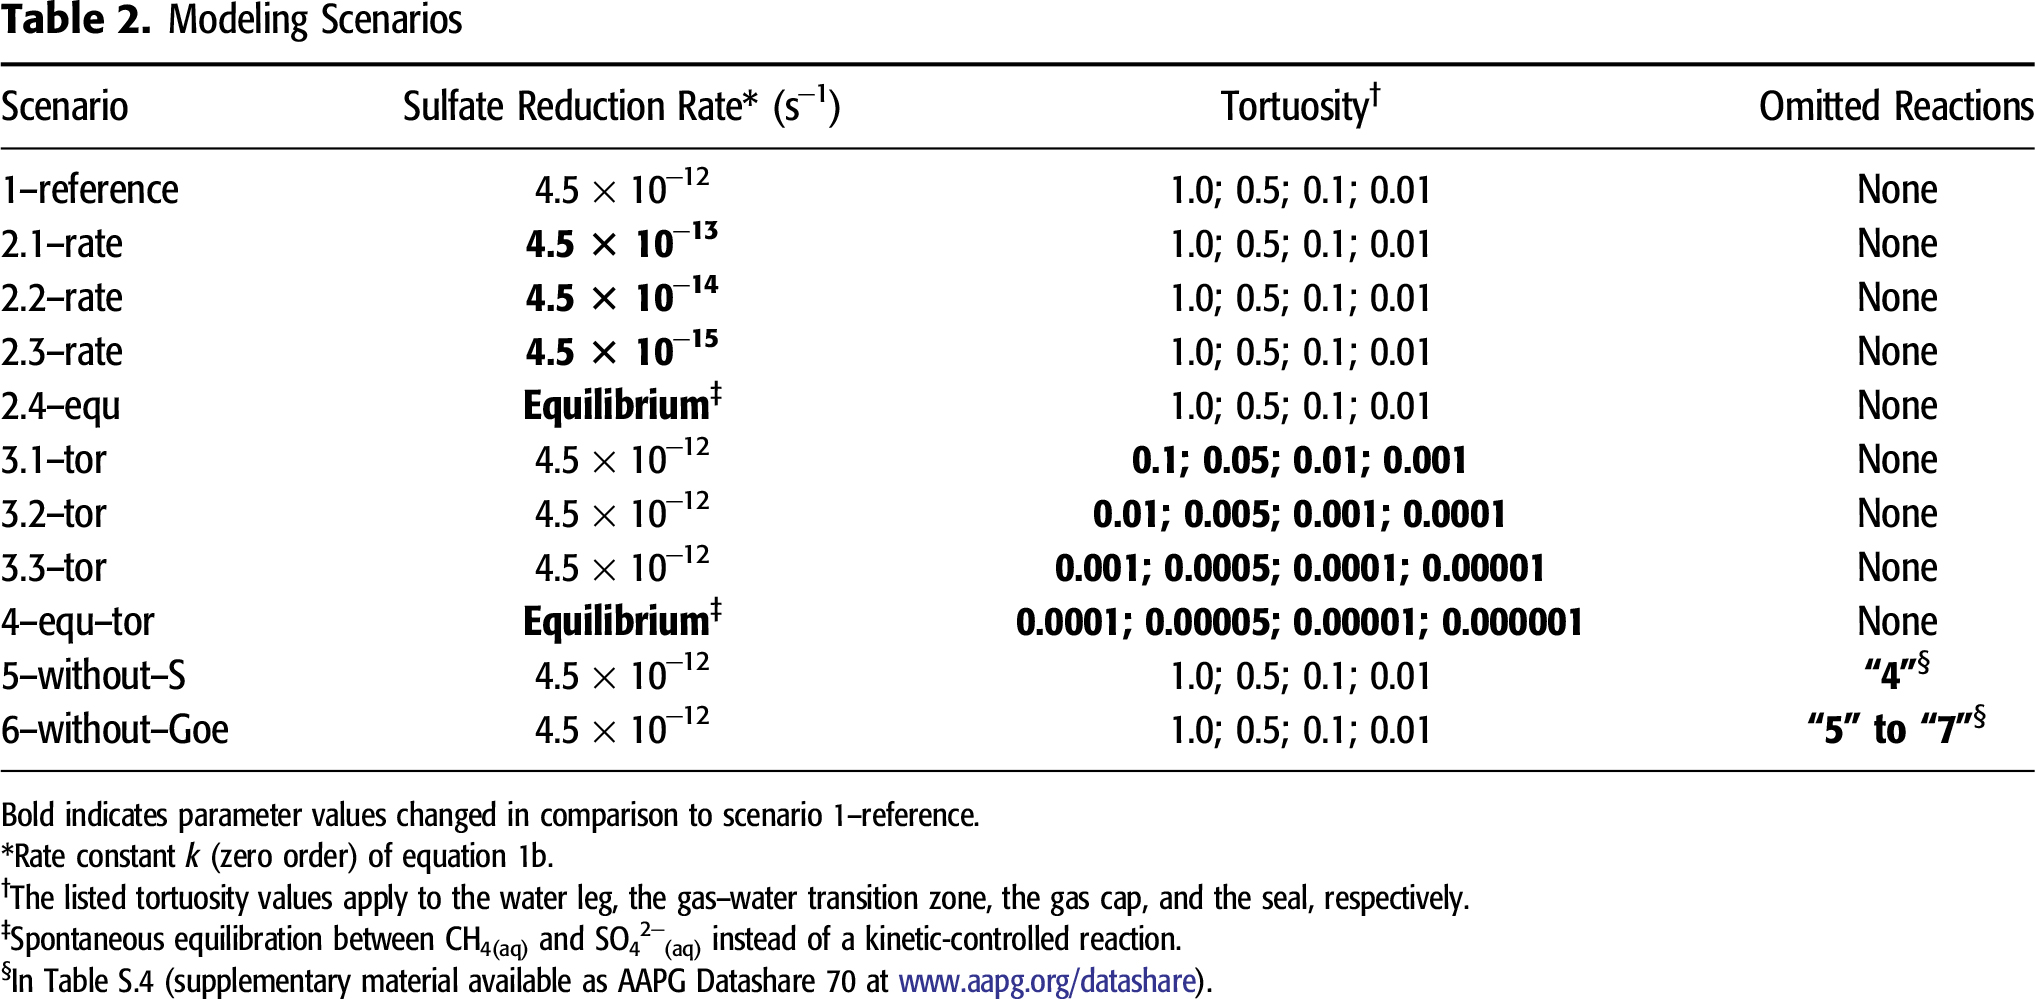
Modeling Scenarios
Because of the lack of data, several parameters, which may have a profound influence on the TSR intensity, must be preassigned in the model by assumptions. However, such assumptions and parameter values tested in our scenarios may not reflect the geological reality. Instead of evaluating the absolute level of calculated results, we compare and discuss these results among different scenarios. Such a comparison shall also help us to identify key factors controlling the overall TSR rate and the H2S concentration in gas.
Artificial effects on produced fluids (e.g., changes in temperature and pressure) would result in H2S outgassing from dissolved S(−II) species(aq) and, consequently, increase the H2S concentration in the gas and decrease the concentration of dissolved S(−II) species in formation water. Thus, the total concentration of S(−II) species can represent and is thus defined as the reservoir souring intensity in our study. The total concentration of S(−II) species present in reservoirs is the sum of the H2S(g) concentration in the gas and the concentration of all dissolved S(−II) species(aq) (including H2S(aq), HS−(aq), S2−(aq), Fe(HS)2(aq), Fe(HS)3−(aq), and S22−(aq) to S62−(aq)).
Scenario 1–reference is based on the conceptual model described in the section titled Geohydraulic Model Part and Hydrogeochemical Model Part (its main parameters are presented in Tables S.1–S.5, supplementary material available as AAPG Datashare 70 at www.aapg.org/datashare). It includes all 7 equilibrium reactions of minerals, all 4 equilibrium reactions among water and gaseous species, and all 49 equilibrium reactions of species(aq) dissociation or association (Tables S.4 and S.5, supplementary material available as AAPG Datashare 70 at www.aapg.org/datashare). Scenario 1–reference uses a rate constant of 4.5 × 10⁻¹² s−1 for SO42−(aq) reduction by CH4(aq). Scenario series 2–rate diminishes the rate constant of ASR stepwise from 4.5 × 10⁻¹³ to 4.5 × 10⁻¹⁵ s−1 (Table 2). One additional rate scenario, 2.4–equ, predefines ASR with CH4(aq) as a spontaneous equilibrium reaction instead of an irreversible, kinetically controlled reaction. Thus, scenario series 2–rate aims to show how strongly the rate constant of ASR affects TSR within a given time span.
Diffusive mass transport supplies SO42−(aq) to CH4(aq) and vice versa. Thus, diffusion intensity seems to be another important factor. To analyze its influence, scenario series 3–tor is calculated for different tortuosity values (Table 2). The other parameters in scenario series 3–tor remain unchanged compared with scenario 1–reference. An alternative scenario, 4–equ–tor, considers extremely low tortuosity values (corresponding to weak diffusive mass transport) and considers ASR as a spontaneous equilibrium reaction to highlight the effects of the rate constant on ASR compared with diffusive mass transport.
Several modeling approaches previously published (e.g., Bildstein et al., 2001) exclude formation of S(0), although this is one of the key processes for TSR (see section titled Previous Modeling Approaches). To determine the effects of potential formation of S(0), scenario 5–without–S leaves the possible formation of S(0)(s) unconsidered (reaction 4 in Table S.4, supplementary material available as AAPG Datashare 70 at www.aapg.org/datashare), although the calculated pore water may reach an oversaturation with respect to S(0)(s). Iron oxides occur as one of frequent impurities in dolomite rocks (Fairbridge et al., 1967) and can provide Fe2+(aq) to fix reduced sulfur in pyrite under suitable pH–pE conditions. Scenario 6–without–Goe omits goethite as a primary mineral phase present before the onset of ASR (reaction 5 in Table S.4). Consequently, the potential formation of secondary pyrite and siderite (reactions 6 and 7 in Table S.4) is suppressed, and this scenario highlights the control of such ferric iron hydroxides or oxides on TSR.
MODELING RESULTS
Because of limited space, the visualization of the spatial and temporal development of two selected parameters relevant for reservoir souring by H2S is restricted to scenario 1–reference: (1) the total concentration of S(−II) (H2S(g) + all S(−II)(aq) species) and (2) the H2S concentration in gas (Figure 3). Additionally, the spatial distribution of the following parameters calculated in scenario 1–reference after 10 m.y. is presented: concentrations of sulfate(aq), CH4(aq), and S(−II)(tot, aq) as well as amounts of dissolved anhydrite, newly formed calcite, S(0)(s), and pyrite (Figure 4). The calculated amounts of dissolved or precipitated minerals are given in the unit mole per kilogram pore water or irreducible water (mol kgw−1) because the porosity among various reservoir parts is different. With consideration of the predefined porosity and water content, this unit can be recalculated to mole per the bulk rock volume, which contains 1 kg of pore (or irreducible) water. Taken anhydrite as example, 100 mol kgw−1 of dissolved anhydrite correspond to the fact that 4.6 L of anhydrite are dissolved in 1 kg of pore water with consideration of a density of 2.96 kg L−1 for anhydrite (Dean, 1999). Because the irreducible water-saturated porosity in the seal is assumed as 1%, 4.6 L of anhydrite are dissolved in ∼100 L of the sealing rocks. Thus, the amount of 100 mol kgw−1 is equivalent to 4.6 vol. % of dissolved anhydrite: 0.046 L is dissolved per liter of the sealing rocks. The PHAST computer program is incapable of calculating diffusive mass transport of gaseous components through a multicomponent gas column. This leads to a strong accumulation of modeled H2S(g) where it forms, especially if diffusive mass transport of aqueous components through the water network and the irreducible water film is weak because of a low tortuosity value. Such unrealistic effects have to be minimized for a better interpretation of the calculated results among different scenarios. Accordingly, a volume-weighted average value is estimated for (1) the H2S concentration in the gas over the total volume of the gas cap and (2) the reservoir souring intensity over the summed volume of the gas cap and the seal part directly overlying the gas cap (Table 3).
 Figure 3. Calculated temporal and spatial evolution of hydrogen sulfide (H2S) concentration in the gas cap and reservoir souring intensity by H2S (summed concentration of gaseous H2S (H2S(g)), aqueous H2S (H2S(aq)), aqueous bisulfide (HS−(aq)), aqueous sulfide ion (S2−(aq)), aqueous ferrous iron di-hydrogen sulfide complex (Fe(HS)2(aq)), aqueous ferrous iron tri-hydrogen sulfide complex (Fe(HS)3−(aq)), and aqueous disulfide ion (S22−(aq)) to aqueous hexa-polysulfide ion (S62−(aq)) for scenario 1–reference.
 Figure 4. Calculated spatial distribution of several parameters after 10 m.y. of thermochemical sulfate reduction for scenario 1–reference. CH4(aq) = aqueous methane; S(−II)(tot, aq) concentration = total concentration of aqueous reduced sulfur in the redox state of −II; S0(s) = elemental sulfur; Sulfate(tot) concentration = total concentration of sulfate.
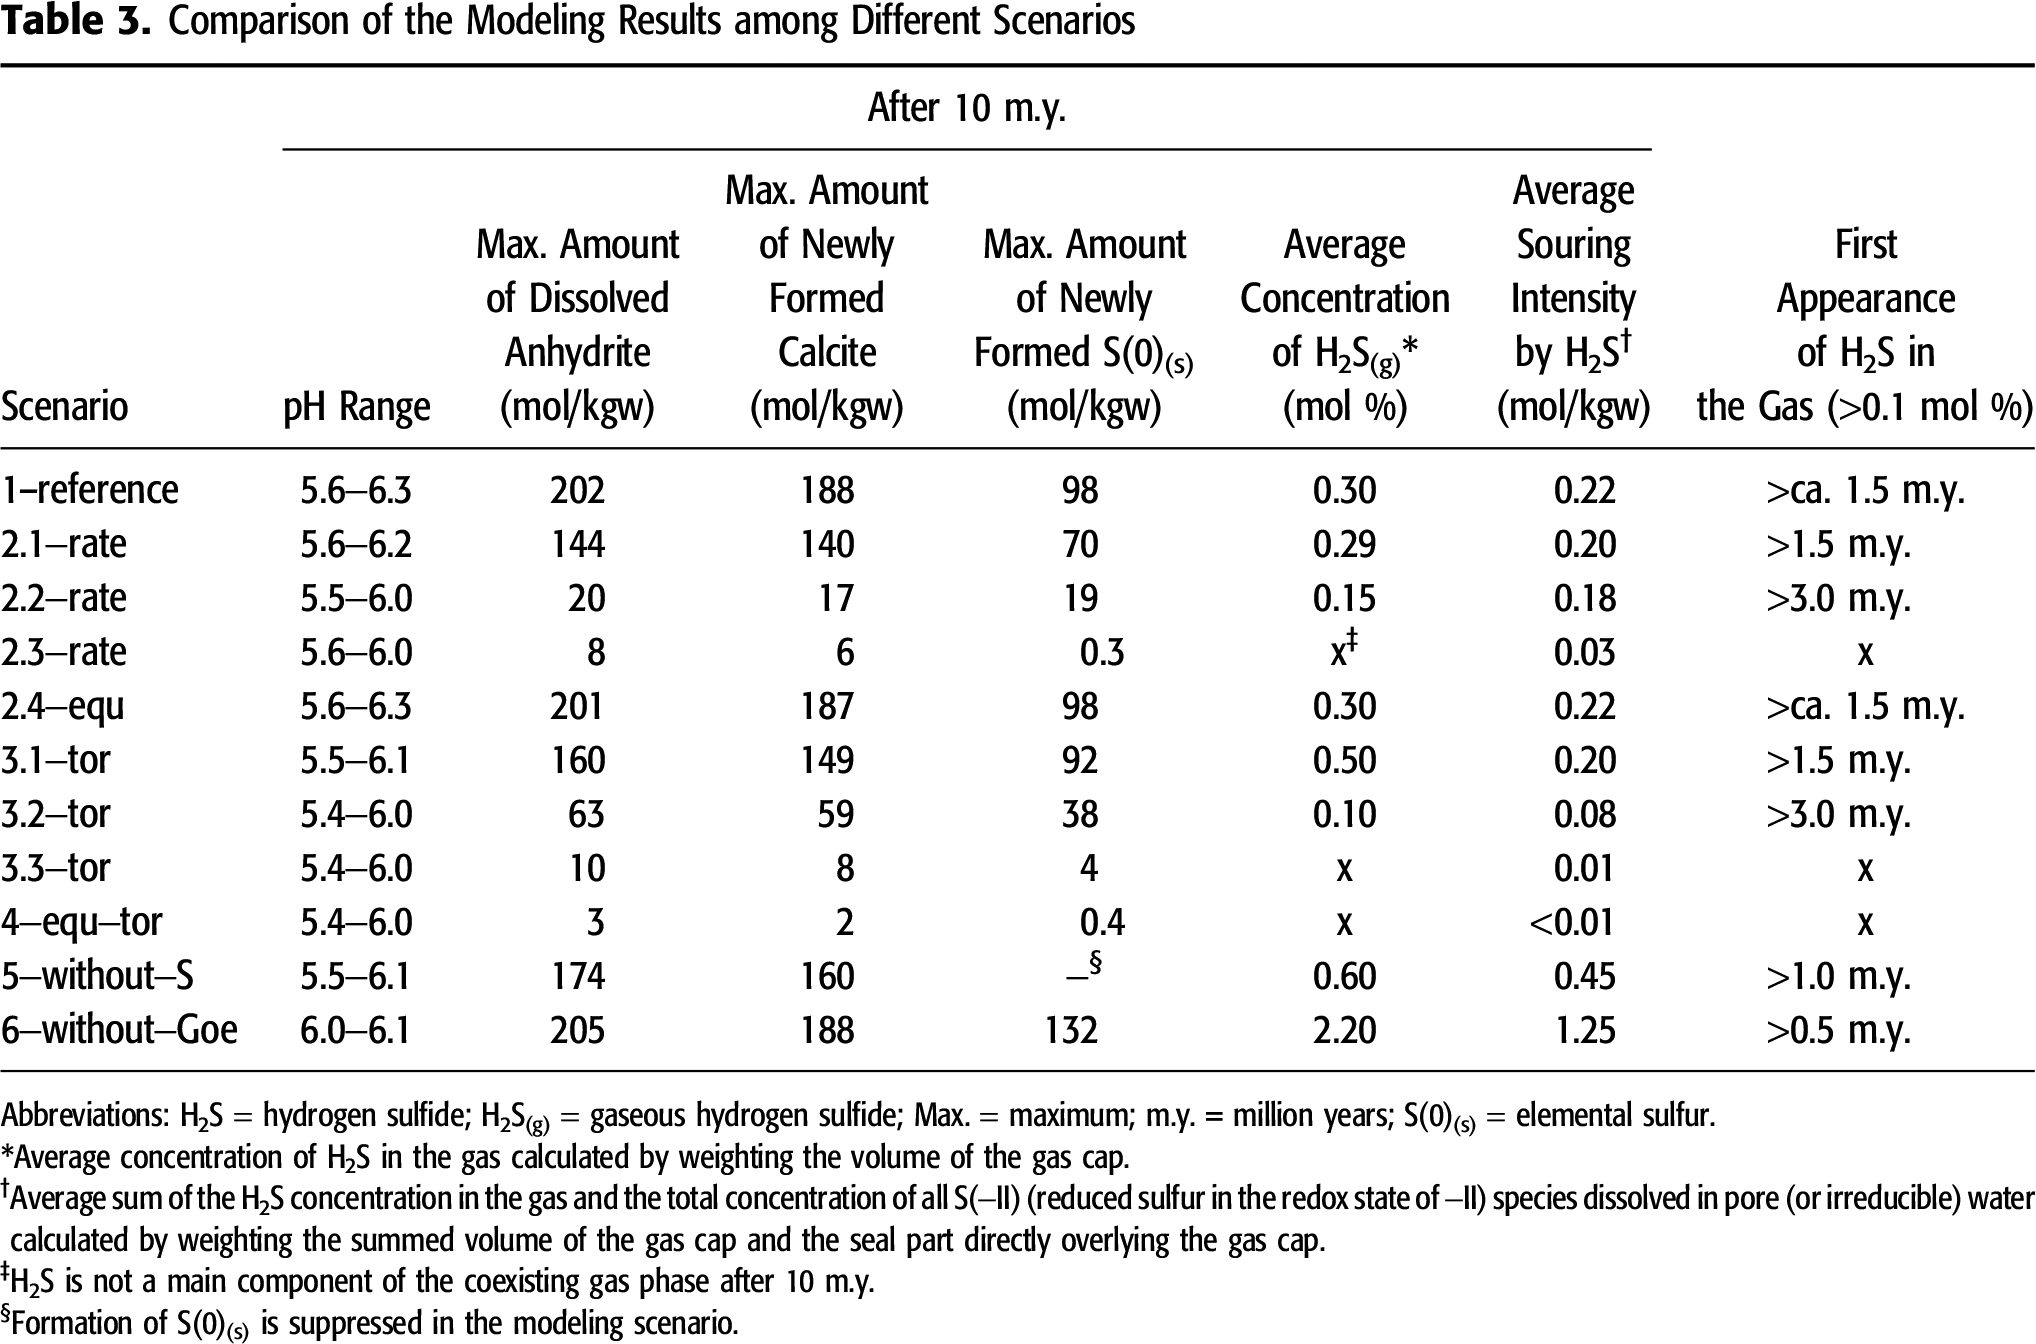
In the following section, the fate and behavior of H2S and the key processes within the TSR web are discussed in detail by using scenario 1–reference as example. The calculated results from alternative scenarios are briefly described and well documented in Appendix 2 and Figures S.2–S.4 (supplementary material available as AAPG Datashare 70 at www.aapg.org/datashare). Table 3 and Figure 5 summarize the modeling results of the parameters relevant for TSR from all other scenarios for comparison to demonstrate how variation of one input parameter affects the intensity of TSR.
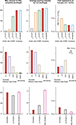 Figure 5. Effects of the kinetic rate of abiotic sulfate reduction (ASR), the intensity of diffusive mass fluxes, and minerals on thermochemical sulfate reduction after 10 m.y. (selected results from Table 3). diss. = dissolved; H2S = hydrogen sulfide; H2S(g) = gaseous hydrogen sulfide; max. = maximum.
Scenario 1–Reference
Within a closed system, diffusive mass transport, which is induced by concentration gradients (e.g., of SO42−(aq) and CH4(aq)), enables an internal redistribution of elements and drives re-equilibration among pore (or irreducible) water, minerals, and gases. This induces a series of hydrogeochemical processes including H2S formation (Figure 3). The SO42−(aq) and CH4(aq) species respectively dominate in the seal as well as in the gas cap and the water leg (Figure 4). The activity of these two components and their redox partners (S2−(aq) and CO32−(aq)) affects the redox conditions. Thus, the pE of aqueous solutions in the seal differs from the gas cap and the water leg (Figure S.1, supplementary material available as AAPG Datashare 70 at www.aapg.org/datashare). This slight difference in redox conditions causes the products of ASR to occur in the form of S(−II) and S(0)(s) in the seal compared with only S(−II) in the gas cap (Figures 3 and 4). More and more S(0)(s) forms with ongoing ASR (98 mol kgw−1 after 10 m.y.; Figure 4). Because the sum of the partial pressures of CH4, H2S, and CO2 in the seal does not exceed the total reservoir pressure of 600 atm (8818 psi), even after 10 m.y. of TSR, S(−II) is present only as aqueous species in the irreducible water of the seal (Figures 3 and 4). The highest total concentration of all aqueous S(−II) species (cS(−II)(tot, aq)) in the seal is located directly above the gas cap and reaches 0.19 mol kgw−1 after 10 m.y. (Figure 3). Because of fixation of S(−II) in newly formed pyrite, H2S is verifiable neither in the irreducible water of the gas cap (cS(−II)(tot, aq) < 2 × 10⁻⁶ mol kgw−1) nor in the gas (H2S concentration in gas < 2 × 10⁻⁵ mol %) before 1.5 m.y., as long as goethite is still present in the reservoir rocks of the gas cap (Figure 4). With ongoing ASR, the H2S concentration in the gas and the souring intensity constantly increase (Figure 3) and reach 0.3 mol % and 0.23 mol per kg pore (or irreducible) water on the average after 10 m.y. (Table 3). Goethite in the gas cap is completely dissolved after 10 m.y. (Figure 4).
The consumption of aqueous sulfate is compensated by ongoing anhydrite dissolution. After 10 m.y., up to 202 mol kgw−1 of anhydrite are dissolved at the contact between the seal and the gas cap (Figure 4; equivalent to 9 vol. % of anhydrite dissolved in the seal). The intensity of anhydrite dissolution subsides with increasing distance from the gas cap (Figure 4). Although anhydrite dissolution constantly releases Ca2+ into aqueous solutions, an increased Ca2+ concentration can be moderated by calcite precipitation. Calcite mostly forms where anhydrite dissolution shows the highest intensity but also partly in the gas cap (Figure 4). Such coupled reactions buffer the effects of ASR on pH (Figure S.1, supplementary material available as AAPG Datashare 70 at www.aapg.org/datashare). Water also forms as one of the TSR products and mostly at the reservoir–seal interface with a maximum value of ∼0.05 kg per kg pore (irreducible) water (Figure S.1). The reservoir rocks in the gas cap are characterized by weak dissolution of dolomite (Figure S.1), which provides free Mg2+ ions to form MgSO40 ions.
Alternative Modeling Scenarios
The rate constant of ASR is commonly regarded as the most important factor controlling TSR. Although the kinetic rate is an inherent property of ASR, an increase in this rate changes other parameters and the mass conversion of all other interconnected reactions within the TSR web, for example, the amount of dissolved anhydrite, of elemental sulfur newly formed, and of secondary calcite as well as the timing of H2S outgassing (Table 3). An elevated rate constant of ASR from 4.5 × 10⁻¹⁵ s−1 in scenario 2.3–rate to 4.5 × 10⁻¹² s−1 in scenario 1–reference causes an increasing overall TSR rate. This is highlighted by (1) a stronger anhydrite dissolution (from 8 to 202 mol kgw−1 of dissolved anhydrite at maximum); (2) a more intensive formation of two typical solid TSR-products, calcite and elemental sulfur (from 6 to 188 mol kgw−1 of secondary calcite and from 0.3 to 98 mol kgw−1 of elemental sulfur newly formed at maximum); (3) a higher average souring intensity by H2S (from 0.03 to 0.22 mol kgw−1); and (4) an earlier appearance of H2S in the gas (from no H2S(g) after 10 m.y. to an outgassing after ∼1.5 m.y.; Table 3, Figures 3–5, and Figure S.2 [supplementary material available as AAPG Datashare 70 at www.aapg.org/datashare]). Scenario 2.4–equ calculates ASR as a spontaneous equilibrium reaction without consideration of any kinetic inhibition. This spontaneous scenario simulates an infinite rate of ASR. However, with respect to all parameters, the modeling results of this scenario resemble scenario 1–reference, which considers ASR as an irreversible, kinetically controlled reaction (Table 3, Figures 3–5, and Figure S.2).
A comparison of scenario 1–reference to the scenario series 3–tor demonstrates that a higher tortuosity leads to an increase in the overall TSR rate. This can be seen in (1) an intensified anhydrite dissolution (from 10 to 202 mol kgw−1 of dissolved anhydrite at maximum); (2) a more massive formation of two typical TSR products, calcite and elemental sulfur (from 8 to 188 mol kgw−1 of secondary calcite and from 4 to 98 mol kgw−1 of elemental sulfur newly formed at maximum); (3) an increasing average souring intensity (from 0.01 to 0.22 mol kgw−1); and (4) an earlier appearance of H2S in the gas (from no H2S(g) after 10 m.y. to an outgassing after ∼1.5 m.y.; Table 3, Figures 3–5, and Figure S.2 [supplementary material available as AAPG Datashare 70 at www.aapg.org/datashare]). Scenario 4–equ–tor considers ASR as an equilibrium reaction together with extremely low tortuosity values compared to scenario 1–reference (Table 2). However, the low tortuosity values of scenario 4–equ–tor significantly reduce the mass conversion of TSR and the souring intensity (Table 3, Figures 3–5, and Figure S.3 [supplementary material available as AAPG Datashare 70 at www.aapg.org/datashare]). In this scenario, H2S does not occur as free gas under reservoir conditions. Moreover, the reservoir rocks affected by TSR are restricted to a narrow area (Figure S.3).
Despite weaker anhydrite dissolution in scenario 5–without–S (174 mol kgw−1 of dissolved anhydrite at maximum), the souring intensity is higher (0.45 mol kgw−1), and free H2S(g) forms earlier (after ∼1.0 m.y. without consideration of S(0)(s) formation) compared with scenario 1–reference (Table 3, Figures 3–5, and Figure S.4 [supplementary material available as AAPG Datashare 70 at www.aapg.org/datashare]). Calculations performed for scenario 6–without–Goe demonstrate that reduced sulfur cannot be fixed as pyrite because of the lack of the ferric iron-bearing mineral goethite. Compared to scenario 1–reference, the H2S concentration in the gas is thus much higher, and H2S(g) is generated much earlier (2.2 mol % and after 0.5 m.y.; Table 1, Figures 3–5, and Figure S.4).
DISCUSSION OF MODELING RESULTS AND LIMITATIONS
The presented model is conceptually based on ASR with methane as an electron donating hydrocarbon and couples geochemical reactions to 3-D and reservoir-wide diffusive mass transport. Our modeling shows that the hot spot of TSR is located at the interface between anhydrite and hydrocarbons (represented by sealing rocks and CH4(g) in our study). The TSR web triggered by ASR includes precipitation of calcite and S(0)(s) as replacements of dissolved anhydrite at the expense of CH4(g). Pyrite forms as response to goethite dissolution. With ongoing ASR, the generated S(−II) species accumulate in pore (or irreducible) water and can become gaseous at the equilibrium partial pressure of H2S(g) (for details, see section titled Modeling Results). These modeled hydrogeochemical processes well agree with the in situ observations relevant for TSR (Table 1). Several studies suggested water as one of the TSR products based on only one selected reaction (e.g., equation 1a). However, only a few case studies provided clear proof of water formation in detectable amounts (Table 1). Considering all reactions potentially contributing to TSR, our calculated results highlight water formation as one of various key processes during TSR. Our modeling approach shows a possible way to quantify the intensity of water formation (0.05 kg water produced per kg pore water in scenario 1–reference). Such a low mass conversion can be the reason why measurable amounts of newly formed water were not commonly observed in TSR case studies. In our modeling, calcite and elemental sulfur are two solid products of TSR and are newly formed at the expense of anhydrite and CH4(g). This agrees well with the observations in many TSR case studies (Tables 1 and 3). The consumption of anhydrite and hydrocarbons is accompanied by formation of H2S, elemental sulfur, and calcite. The total concentration of S(−II) species calculated for the pore water in the gas cap has an average value of 2.4 g kgw−1 (Figure 4; scenario 1–reference), which is consistent with the measured data of up to 3 g kgw−1 measured by Cai et al. (2003) (Table 1). The total concentration of dissolved sulfur (S(−II) + sulfate) calculated for scenario 1–reference reaches 0.22 mol kgw−1 at maximum (Figure 4), which falls in the concentration range described by Goldhaber and Orr (1995) (at a temperature <200°C (392°F) in sour gas reservoirs). Our modeling approach does not select specific reactions from the TSR web or, in other words, was not calibrated according to the observations and the measured data in real reservoirs affected by TSR. Thus, a good match between our results and field data can be concluded. This match validates that our 3-D HRMT modeling approach reproduces the complex web of TSR at the reservoir scale.
In situ water formation reinforces TSR by promoting anhydrite dissolution and by increasing the water content because only trace amounts of pore water are initially available in the seal and the gas cap. Additional dissolution of anhydrite induced by water formation subsequently replenishes the aqueous sulfate stock available for TSR. Moreover, an increase in water content intensifies diffusive mass transport. Thus, TSR may evolve as a self-propagating process to a certain extent. It creates more and more aqueous microenvironments within initially drier environments and provides trace amounts of in situ formed water, especially at the reservoir–seal contact.
A higher rate constant of ASR increases the H2S concentration in the gas and the souring intensity and promotes H2S outgassing (Table 3). However, an increase in the kinetic rate of ASR cannot infinitely intensify TSR. The modeling unravels that a rate constant higher than the order of magnitude of ∼10−12 s−1 under the preassigned reservoir initial conditions (ASR as a zero-order reaction in our study) is incapable of further increasing the overall TSR rate and the resulting souring intensity (cf. 1−reference and 2.4−equ). One of the main outcomes from our modeling is that one very important, if not the most important, controlling factor of TSR at the reservoir scale is diffusive mass transport. The scenario series varying the tortuosity shows that stronger diffusive mass transport (in other words, increasing tortuosity at a constant diffusivity) increases the overall rate of TSR and the souring intensity by H2S. The alternative scenario 4–equ–tor considers an extremely low diffusion intensity. This scenario regards ASR as a spontaneous equilibrium reaction. This almost equals an extreme situation that considers an infinite rate of ASR. However, the effects of TSR calculated in scenario 4–equ–tor are spatially limited in the reservoir because of weak diffusive mass transport and, additionally, are of low intensity. The low tortuosity values, in other words, the low intensity of diffusive mass transport, may not mimic the geological reality. Conversely, this indicates that diffusive mass transport is one of the prerequisites besides ASR as the driving force of TSR at the reservoir scale. Stronger diffusive mass transport leads to an increased overall TSR rate and to an earlier formation of free H2S gas.
The scenario series, from 1–reference, 2.1–rate, 2.2–rate, to 2.3–rate, systematically varies the kinetic rate of ASR stepwise by one order of magnitude (Table 2). The modeling results irregularly change among these four scenarios (Table 3), for example, by minor changes in pH. This irregular change can also be observed in the modeling scenario series considering a stepwise variation of tortuosity (1–reference, 3.1–tor, 3.2–tor, and 3.3–tor; Tables 2 and 3). This points to the fact that no simple correlation exists between one factor and the parameters relevant for TSR. Thus, modeling approaches based on one or two simple equations are incapable of predicting realistic H2S concentrations.
Several modeling approaches focus on selected reactions of interest, not on all potential reactions, such as exclusion of S(0) formation in the model presented by Bildstein et al. (2001). Scenario 5–without–S suppresses S(0) formation, although it is thermodynamically stable at the defined reservoir temperature and pressure conditions. Exclusion of S(0) formation from the model leads to a remarkable increase in the H2S gas content and in the souring intensity (cf. 5–without–S and 1–reference in Table 3). This comparison emphasizes the importance of a holistic approach considering all potential reactions for evaluating hydrogeochemical processes, such as for assessing H2S risks. Considering goethite as the representative for metal hydroxides or oxides, our modeling quantitatively shows that the concentration of H2S in gas remains low (<2 × 10⁻⁵ mol % in the case of goethite as a primary mineral), as long as metal hydroxides or oxides are available in the reservoir rocks. Metal (di-)sulfides act as a strong sink for most of the reduced sulfur that results from ASR. Precipitation of metal (di-)sulfides can thus retard the formation of gaseous H2S. Therefore, during TSR over a given time span, the mineralogical composition of the reservoir rocks has a significant influence on the concentration of H2S in the gas and on the reservoir souring intensity (cf. 1–reference and 6–without–Goe).
The results calculated in different scenarios clearly show that several parameters can strongly affect the souring intensity by H2S. These parameters range from the kinetic rate of ASR, the mineralogical composition (e.g., primary metal-bearing minerals resulting in precipitation of (di-)sulfides), to the main geohydraulic parameter identified here as the intensity of diffusive mass transport. Thus, a variety of parameter combinations can result in a similar souring intensity calculated in different scenarios. As a consequence, it is impossible to retrace the reasonable kinetic rate of ASR based on a measured H2S concentration by tuning various reservoir parameters.
The reaction educts relevant for ASR occur in different reservoir parts: as anhydrite for sulfate ions and as CH4 in the gas cap (taken as example for hydrocarbons). Thus, diffusion has to transport sulfate and CH4 to the ASR reaction sites where TSR products can be also monitored. Anhydrite occurs in petroleum systems as sealing rocks or as nodules in the reservoir rocks. In our semigeneric study, the anhydrite seal delivers sulfate ions available for TSR. The mineralized products of TSR, calcite and elemental sulfur, are mainly precipitated at the reservoir–seal interface. If anhydrite occurs as nodules in a carbonate reservoir, such products of TSR could be observed in the gas cap or even in the water leg. However, elemental sulfur is liquid at reservoir temperatures higher than ∼150°C (302°F) (Bildstein et al., 2001). Our modeling approach considers solid elemental sulfur as the potential secondary mineral because of the lack of thermodynamic data. This replacement may affect the calculated overall TSR rate and the reservoir souring intensity to a certain degree. Because of its liquid nature and low density at the chosen reservoir conditions, the occurrence of elemental S(0) may be not restricted to the locations where it forms at the reservoir–seal interface and in the seal. Liquid elemental S(0) may move upward and further penetrate deeply into the seal. Thus, only calcite newly formed near altered anhydrite could serve as one solid indicator for the TSR reaction sites, which is preserved in the reservoir rocks.
The application of 3-D reactive transport modeling presented in our study provides a good example of how such an approach could help to identify fundamental parameters relevant for H2S formation, its subsequent fate, and its hydrogeochemical behavior in anhydrite-bearing reservoirs. The presented findings have several geological implications, such as evaluation of the seal integrity, especially for thin or regionally out-pinching evaporates, or lateral facies changes of seal sediments (e.g., changing from anhydrite into claystones or carbonates). Predrilling PHAST modeling should be applied for the risk assessment and should be coupled to alternative, nonmodeling approaches. A set of various predrilling PHAST modeling scenarios could be performed with consideration of a broad range of parameter values and their combinations. Such combinations should integrate, for example, (1) the estimated time span relevant for TSR according to the filling and thermal history; (2) the assumed ASR rate; (3) the estimated thickness of the water leg, gas cap, and seal; (4) the porosity, the tortuosity, and the content of free and irreducible water; (5) the mineralogical composition of reservoir rocks and seal; (6) the presence of sulfate minerals distributed throughout the reservoir or restricted to the seal; and (7) the presence of metal-bearing minerals with potential to bind sulfidic species. Such modeling series could cover a wide spectrum of worst- and best-case conditions regarding the temporal development and the spatial expansion of reservoir souring intensity and H2S contents. Seal integrity is one key to evaluate a past to present leakage. Specialized modeling can focus on (1) quantification of the amounts and volumes of dissolved anhydrite and how much of these products are converted to calcite and elemental sulfur and (2) identification of the hot spots of mass conversions. Additionally, reservoir parameters, which are identified as the process-dominating factors for TSR based on the results from various modeling scenarios, should be preferentially examined during exploration.
The modeling results should be reviewed by plausibility tests, which are integral parts of the suggested methodical approach. Such reviews shall verify whether modeling results fit the measured data in reservoirs affected by TSR. The quality and completeness of measured data sets as well as the number of case studies available for such plausibility tests are decisive to further develop and improve the modeling approach for a better H2S prediction.
Several factors can affect the modeling results but are unconsidered in our study: (1) changing temperature and pressure conditions during the modeling time span of 10 m.y., (2) temperature and pressure gradients within the reservoir, and (3) a heterogeneous distribution of reservoir rock properties. To reduce pressure effects on the modeling results, the equilibrium constants of minerals and gases were separately calculated for the initial pore water (before ASR onset) under elevated temperature and pressure conditions. PHREEQC Interactive 3.1.4 calculates pressure effects on these equilibrium constants depending on ionic strength. During TSR, mineral dissolution and precipitation as well as water formation can change the ionic strength of pore (or irreducible) water. However, changes in ionic strength may change the calculated equilibrium constants of minerals and gases (Table S.4, supplementary material available as AAPG Datashare 70 at www.aapg.org/datashare) during TSR in the geological reality. Moreover, pressure effects on the equilibrium constants of dissociation or association reactions of aqueous species are unconsidered in our study. Nevertheless, many of these reactions are insensitive to pressure changes at a constant temperature lower than 250°C (482°F) (Wesolowski et al., 2004).
The PHAST computer program is incapable of calculating diffusion of gaseous components through a multicomponent gas. This leads to strong and unrealistic H2S(g) accumulation where it forms in the gas cap. Consequently, a volume-weighted average value is estimated for the H2S concentrations in the gas and the reservoir souring intensity. We are aware that the spacing of grid blocks and the size of time steps applied in our numerical simulation (the spatial and temporal discretization) also affect the calculated results, e.g., the absolute amounts of newly formed minerals. However, all of our modeling scenarios use the same spatial and temporal discretization. Thus, we compared calculated results from different scenarios instead of determining the absolute level of the parameters (e.g., the H2S(g) concentration) that are relevant for TSR. Thus, the interpretation of the effects caused by factor variability in different scenarios (e.g., different rate constants of ASR) is valid.
Despite several limitations, the presented 3-D HRMT modeling provides a new and useful way to deepen our qualitative and quantitative understanding of TSR at the reservoir scale. A further outcome of this study is the evaluation of several parameters that contribute to the overall TSR rate, H2S formation, fate, and behavior, as well as changes in the reservoir porosity resulting from TSR.
CONCLUSIONS
It is common to overemphasize the importance of the rate constant of ASR by typical petroleum compounds on TSR at the reservoir scale. The reason is that most previous studies about TSR only focused on the rate constant of ASR. In contrast, our semigeneric 3-D reactive mass transport modeling integrates reservoir-wide diffusive mass transport to a series of geochemical reactions (equilibrium and kinetically controlled reactions), which interact with each other and contribute together to TSR. It considers different factors that potentially affect the overall TSR rate and the resulting reservoir souring intensity.
Our modeling results show that the hot spot of TSR is located at the interface between anhydrite and hydrocarbons (represented by sealing rocks and CH4(g) in the gas cap in our study). The calculated diagenetic processes and parameters fit the observations in field TSR studies: formation of water, precipitation of calcite, metal (di-)sulfides, and elemental sulfur as replacement of dissolved anhydrite at the expense of CH4(g), as well as formation of gaseous H2S. Different modeling scenarios highlight that a higher rate constant of ASR increases the overall TSR rate and the resulting reservoir souring intensity at the reservoir scale within a given time span. However, the development of such an increase is limited. For example, under the simulated reservoir conditions (e.g., temperature, mineralogical composition of reservoir rocks, and ASR as a zero-order reaction), an increase in the overall TSR rate and the souring intensity, which results from the increasing rate constant of ASR, is restricted to a rate constant lower than ∼10−12 s−1. The presence of goethite or other metal hydroxides or oxides can significantly weaken reservoir souring intensity and retard or even suppress formation of gaseous H2S because of precipitation of metal (di-)sulfides.
With regard to TSR, the effects of reservoir-wide diffusive mass transport have been commonly underestimated or even ignored. In contrast, one of the main outcomes from our modeling is that diffusive mass transport is an important, if not the most important, factor controlling the overall TSR rate as well as its temporal and spatial evolution at the reservoir scale. Reservoir rocks, which allow strong diffusive mass transport (e.g., because of high tortuosity and high contents of irreducible water), could often face widespread TSR effects and a high H2S souring risk. In contrast, reservoirs, which are characterized by (1) a low kinetic rate constant of ASR (e.g., caused by a low reservoir temperature or lack of saturated n-alkanes with higher molecular weights), (2) a low potential of diffusive mass transport (e.g., caused by low tortuosity or low content of irreducible water), and/or (3) high amounts of reactive metal-bearing minerals with potential to bind sulfidic species in the reservoir rock mineral assemblage, would show a low overall TSR rate and undergo weak reservoir souring.
One scenario excludes formation of elemental sulfur, which was proven as one of the TSR products. The results of this scenario highlight the importance of a holistic modeling approach by integrating all interconnected reactions. Any modeling approach that is based on selected reactions of interest overestimates or underestimates the reservoir souring intensity. Because the TSR web couples interconnected geochemical reactions to mass transport processes, no simple correlation exists between one key factor (e.g., kinetic rate of ASR) and the intensity of TSR (e.g., amount of dissolved anhydrite, H2S(g) content). Thus, a complex transport modeling is recommended to access H2S risks induced by ASR. In summary, the application of 3-D reactive transport modeling presented in our study provides a good example of how such an approach could help to identify fundamental parameters relevant for H2S formation, its subsequent fate, and its hydrogeochemical behavior in anhydrite-bearing reservoirs. Such a complex modeling approach enables a better understanding of TSR processes at the reservoir scale in a quantitative way. Moreover, it helps to predict the temporal and spatial evolution of the overall TSR rate and the reservoir souring by H2S.
REFERENCES CITED
Amrani, A., T. Zhang, Q. Ma, G. S. Ellis, and Y. Tang, 2008, The role of labile sulfur compounds in thermochemical sulfate reduction: Geochimica et Cosmochimica Acta, v. 72, p. 2960–2972, doi:10.1016/j.gca.2008.03.022.
Attia, A. M., 2005, Effects of petrophysical rock properties on tortuosity factor: Journal of Petroleum Science Engineering, v. 48, p. 185–198, doi:10.1016/j.petrol.2005.06.012.
Bildstein, O., R. H. Worden, and E. Brosse, 2001, Assessment of anhydrite dissolution as the rate limiting step during thermochemical sulfate reduction: Chemical Geology, v. 176, p. 173–189, doi:10.1016/S0009-2541(00)00398-3.
Cai, C., R. H. Worden, S. H. Bottrell, L. Wang, and C. Yang, 2003, Thermochemical sulphate reduction and the generation of hydrogen sulphide and thiols (mercaptans) in Triassic carbonate reservoirs from the Sichuan Basin, China: Chemical Geology, v. 202, p. 39–57, doi:10.1016/S0009-2541(03)00209-2.
Cai, C., Z. Xie, R. H. Worden, G. Hu, L. Wang, and H. He, 2004, Methane-dominated thermochemical sulphate reduction in the Triassic Feixiangguan Formation East Sichuan Basin, China: Towards prediction of fatal H2S concentrations: Marine and Petroleum Geology, v. 21, p. 1265–1279, doi:10.1016/j.marpetgeo.2004.09.003.
Cross, M. M., D. A. C. Manning, S. H. Bottrell, and R. H. Worden, 2004, Thermochemical sulphate reduction (TSR): Experimental determination of reaction kinetics and implications of the observed reaction rates for petroleum reservoirs: Organic Geochemistry, v. 35, p. 393–404, doi:10.1016/j.orggeochem.2004.01.005.
Dean, J. A., 1999, Lange’s handbook of chemistry, 15th ed.: New York, McGraw-Hill, p. 3.23.
Ellis, G. S., T. Zhang, Q. Ma, and Y. Tang, 2006, Empirical and theoretical evidence for the role of MgSO4 contact ion-pairs in thermochemical sulfate reduction: AGU Fall Meeting Abstracts 2006, V11C-0596.
Ewing, R. P., Q. Hu, and C. Liu, 2010, Scale dependence of intragranular porosity, tortuosity, and diffusivity: Water Resources Research, v. 46, W06513, doi:10.1029/2009WR008183.
Fairbridge, R. W., G. V. Chilingar, and H. J. Bissell, 1967, Introduction, in Chilingar, G. V., H. J. Bissell, and R. W. Fairbridge, eds., Carbonate rocks: Origin, occurrence and classification, Developments in Sedimentology 9A: Amsterdam, Elsevier, p. 1–28, doi:10.1016/S0070-4571(08)71109-9.
Giambalvo, E. R., C. I. Steefel, A. T. Fisher, N. D. Rosenberg, and C. G. Wheat, 2002, Effect of fluid-sediment reaction on hydrothermal fluxes of major elements, eastern flank of the Juan de Fuca Ridge: Geochimica et Cosmochimica Acta, v. 66, p. 1739–1757, doi:10.1016/S0016-7037(01)00878-X.
Ghassemi, A., and A. Pak, 2011, Pore scale study of permeability and tortuosity for flow through particulate media using Lattice Boltzmann method: International Journal for Numerical and Analytical Methods in Geomechanics, v. 35, p. 886–901, doi:10.1002/nag.932.
Goldhaber, M. B., and W. L. Orr, 1995, Kinetic controls on thermochemical sulfate reduction as a source of sedimentary H2S, in Vairavamurthy, M. A., and M. A. A. Schoonen, eds., Geochemical transformations of sedimentary sulfur: ACS Symposium Series 612: Washington, DC, American Chemical Society, p. 412–425.
Hao, F., X. Zhang, C. Wang, P. Li, H. Zou, Y. Zhu, J. Liu, and Z. Cai, 2015, The fate of CO2 derived from thermochemical sulfate reduction (TSR) and effect of TSR on carbonate porosity and permeability, Sichuan Basin, China: Earth-Science Reviews, v. 141, p. 154–177, doi:10.1016/j.earscirev.2014.12.001.
Helgeson, H. C., A. M. Knox, C. E. Owens, and E. L. Shock, 1993, Petroleum, oil field waters, and authigenic mineral assemblages: Are they in metastable equilibrium in hydrocarbon reservoirs?: Geochimica et Cosmochimica Acta, v. 57, p. 3295–3339, doi:10.1016/0016-7037(93)90541-4.
Heydari, E., 1997, The role of burial diagenesis in hydrocarbon destruction and H2S accumulation, Upper Jurassic Smackover Formation, Black Creek Field, Mississippi: AAPG Bulletin, v. 81, no. 1, p. 26–45.
Hsieh, P. A., and R. B. Winston, 2002, User’s guide to Model Viewer, a program for three-dimensional visualization of groundwater model results: US Geological Survey Open-File Report 02-106, 18 p.
Jenden, P. D., P. A. Titley, and R. H. Worden, 2015, Enrichment of nitrogen and 13C of methane in natural gases from the Khuff Formation, Saudi Arabia, caused by thermochemical sulfate reduction: Organic Geochemistry, v. 82, p. 54–68, doi:10.1016/j.orggeochem.2015.02.008.
Jiang, L., R. H. Worden, and C. Cai, 2015, Generation of isotopically and compositionally distinct water during thermochemical sulfate reduction (TSR) in carbonate reservoirs: Triassic Feixianguan Formation, Sichuan Basin, China: Geochimica et Cosmochimica Acta, v. 165, p. 249–262, doi:10.1016/j.gca.2015.05.033.
Ma, Q., G. S. Ellis, A. Amrani, T. Zhang, and Y. Tang, 2008, Theoretical study on the reactivity of sulfate species with hydrocarbons: Geochimica et Cosmochimica Acta, v. 72, p. 4565–4576, doi:10.1016/j.gca.2008.05.061.
Machel, H. G., 2001, Bacterial and thermochemical sulfate reduction in diagenetic settings—Old and new insights: Sedimentary Geology, v. 140, p. 143–175, doi:10.1016/S0037-0738(00)00176-7.
Manzano, B. K., M. G. Fowler, and H. G. Machel, 1997, The influence of thermochemical sulphate reduction on hydrocarbon composition in Nisku reservoirs, Brazeau river, Alberta, Canada: Organic Geochemistry, v. 27, p. 507–521, doi:10.1016/S0146-6380(97)00070-3.
Mougin, P., V. Lamoureux-Var, A. Bariteau, and A. Y. Huc, 2007, Thermodynamic of thermochemical sulphate reduction: Journal of Petroleum Science Engineering, v. 58, p. 413–427, doi:10.1016/j.petrol.2007.01.005.
Nöth, S., 1997, High H2S contents and other effects of thermochemical sulfate reduction in deeply buried carbonate reservoirs: A review: Geologische Rundschau, v. 96, p. 275–287.
Oelkers, E. H., and H. C. Helgeson, 1988, Calculation of the thermodynamic and transport properties of aqueous species at high pressures and temperatures: Aqueous tracer diffusion coefficients of ions to 1000°C and 5 kb: Geochimica et Cosmochimica Acta, v. 52, p. 63–85, doi:10.1016/0016-7037(88)90057-9.
Parkhurst, D. L., and C. A. J. Appelo, 2013, Description of input and examples for PHREEQC Version 3—A computer program for speciation, batch-reaction, one-dimensional transport, and inverse geochemical calculations: US Geological Survey Techniques and Methods 6–A43, 497 p.
Parkhurst, D. L., K. L. Kipp, and S. R. Charlton, 2010, PHAST Version 2—A program for simulating groundwater flow, solute transport, and multicomponent geochemical reactions: US Geological Survey Techniques and Methods 6–A35, 235 p.
Peters, K. E., T. Hantschel, A. I. Kauerauf, Y. Tang, and B. Wygrala, 2013, Recent advances in petroleum system modeling of geochemical processes: TSR, SARA, and biodegradation: AAPG Search and Discovery article 41261, accessed November 10, 2015, http://www.searchanddiscovery.com/pdfz/documents/2013/41261peters/ndx_peters.pdf.html.
Riciputi, L. R., D. R. Cole, and H. G. Machel, 1996, Sulfide formation in reservoir carbonates of the Devonian Nisku Formation, Alberta, Canada: An ion microprobe study: Geochimica et Cosmochimica Acta, v. 60, p. 325–336, doi:10.1016/0016-7037(96)83133-4.
Seewald, J. S., 2003, Organic-inorganic interactions in petroleum-producing sedimentary basins: Nature, v. 426, p. 327–333, doi:10.1038/nature02132.
Shen, L., and Z. Chen, 2007, Critical review of the impact of tortuosity on diffusion: Chemical Engineering Science, v. 62, p. 3748–3755, doi:10.1016/j.ces.2007.03.041.
Tang, Y., G. S. Ellis, T. Zhang, and Y. Jin, 2005, Effects of aqueous chemistry on thermal stability of hydrocarbons in petroleum reservoirs (abs.): Goldschmidt Conference Abstracts, v. 2005, p. A559.
van Berk, W., H.-M. Schulz, and Y. Fu, 2009, Hydrogeochemical modeling of CO2 equilibria and mass transfer induced by organic-inorganic interactions in siliciclastic petroleum reservoirs: Geofluids, v. 9, p. 253–262, doi:10.1111/j.1468-8123.2009.00256.x.
van Berk, W., H.-M. Schulz, and Y. Fu, 2013, Controls on CO2 fate and behavior in the Gullfaks oilfield (Norway): How hydrogeochemical modeling can help to decipher organic-inorganic interactions: AAPG Bulletin, v. 97, no. 12, p. 2233–2255, doi:10.1306/04301312142.
Videtich, P. E., 1994, Dolomitization and H2S generation in the Permian Khuff Formation, Offshore Dubai, U.A.E.: Carbonates and Evaporites, v. 9, p. 42–57, doi:10.1007/BF03175185.
Wesolowski, D. J., S. E. Ziemniak, L. M. Anovitz, M. L. Machesky, P. Bénézeth, and D. A. Palmer, 2004, Solubility and surface adsorption characteristics of metal oxides, in Palmer, D. A., R. Fernández-Prini, and A. H. Harvey, eds., Aqueous systems at elevated temperatures and pressures: Physical chemistry in water, steam and hydrothermal solutions: London, Elsevier, p. 493–595, doi:10.1016/B978-012544461-3/50015-6.
Worden, R. H., and P. C. Smalley, 1996, H2S-producing reactions in deep carbonate gas reservoirs: Khuff Formation, Abu Dhabi: Chemical Geology, v. 133, p. 157–171, doi:10.1016/S0009-2541(96)00074-5.
Worden, R. H., P. C. Smalley, and A. E. Fallick, 1997, Sulfur cycle in buried evaporites: Geology, v. 25, p. 643–646, doi:10.1130/0091-7613(1997)025<0643:SCIBE>2.3.CO;2.
Worden, R. H., P. C. Smalley, and N. H. Oxtoby, 1996, The effects of thermochemical sulfate reduction upon formation water salinity and oxygen isotopes in carbonate gas reservoirs: Geochimica et Cosmochimica Acta, v. 60, p. 3925–3931, doi:10.1016/0016-7037(96)00216-5.
Yue, C., S. Li, K. Ding, and N. Zhong, 2006, Thermodynamics and kinetics of reactions between C1–C3 hydrocarbons and calcium sulfate in deep carbonate reservoirs: Geochemical Journal, v. 40, p. 87–94, doi:10.2343/geochemj.40.87.
Zhang, T., A. Amrani, G. S. Ellis, Q. Ma, and Y. Tang, 2008, Experimental investigation on thermochemical sulfate reduction by H2S initiation: Geochimica et Cosmochimica Acta, v. 72, p. 3518–3530, doi:10.1016/j.gca.2008.04.036.
Zhang, T., G. S. Ellis, K. Wang, C. C. Walters, S. R. Kelemen, B. Gillaizeau, and Y. Tang, 2007, Effect of hydrocarbon type on thermochemical sulfate reduction: Organic Geochemistry, v. 38, p. 897–910, doi:10.1016/j.orggeochem.2007.02.004.
AUTHORS
Yunjiao Fu received her Ph.D. in 2014 from the Clausthal University of Technology, Germany, and is currently a postdoctoral researcher at the Helmholtz Centre Potsdam—GFZ German Research Centre for Geosciences. Her research focuses on scaling processes triggered by seawater injection, on water–rock–gas interactions at oil–water contacts, and on thermochemical sulfate reduction in petroleum systems by using hydrogeochemical modeling.
Wolfgang van Berk was educated as a chemist and, later, as a geologist at the Geological Institute of the Ruhr-University, Germany. He is a professor for hydrogeology at the Clausthal Technical University and specializes in hydrogeochemical modeling. He applies modeling to the fields of water–rock–gas interactions in near-surface groundwater, in hydrocarbon reservoirs, and on ancient Mars.
Hans-Martin Schulz is a senior research scientist at the Helmholtz Centre Potsdam–GFZ German Research Centre for Geosciences. He holds a diploma and a Ph.D. in geology, both from the RWTH Aachen University, Germany, and is lecturer for petroleum geology at the Clausthal University of Technology, Germany. His research interests include organic–inorganic interactions in conventional and unconventional oil and gas systems and nanogeomaterials.
ACKNOWLEDGMENTS
We are very grateful to the reviewers Darryl Green and Brigitte Doligez, as well as the AAPG Editor Michael L. Sweet for their comments that helped to substantially improve the manuscript.
DATASHARE 70
Appendices 1 and 2, Tables S.1–S.5, and Figures S.1–S.4 are available in an electronic version on the AAPG website (www.aapg.org/datashare) as Datashare 70.