The AAPG/Datapages Combined Publications Database
AAPG Bulletin
Full Text
![]() Click to view page images in PDF format.
Click to view page images in PDF format.
AAPG Bulletin, V.
DOI: 10.1306/11111917396
Quantitative carbonate sequence stratigraphy: Insights from stratigraphic forward models
Jean Borgomano,1 Cyprien Lanteaume,2 Philippe Léonide,3 François Fournier,4 Lucien F. Montaggioni,5 and Jean-Pierre Masse6
1Observatoire des Sciences de l’Univers (OSU) Institut Pythéas, Centre National de la Recherche Scientifique (CNRS) (Joint Research Unit [UMR] 7330), Institut de Recherche pour le Développement (IRD) (UMR 161), Collège de France - USC INRA, Centre Européen de Recherche et d’Enseignement de Géosciences de l’Environnement (CEREGE), Aix-Marseille Université, Aix-en-Provence, France; [email protected]
2OSU Institut Pythéas, CNRS (UMR 7330), IRD (UMR 161), Collège de France - USC INRA, CEREGE, Aix-Marseille Université, Aix-en-Provence, France; Modis Pau, Pau, France; [email protected]
3OSU Institut Pythéas, CNRS (UMR 7330), IRD (UMR 161), Collège de France - USC INRA, CEREGE, Aix-Marseille Université, Aix-en-Provence, France; [email protected]
4OSU Institut Pythéas, CNRS (UMR 7330), IRD (UMR 161), Collège de France - USC INRA, CEREGE, Aix-Marseille Université, Aix-en-Provence, France; [email protected]
5OSU Institut Pythéas, CNRS (UMR 7330), IRD (UMR 161), Collège de France - USC INRA, CEREGE, Aix-Marseille Université, Aix-en-Provence, France; [email protected]
6OSU Institut Pythéas, CNRS (UMR 7330), IRD (UMR 161), Collège de France - USC INRA, CEREGE, Aix-Marseille Université, Aix-en-Provence, France; [email protected]
ABSTRACT
A method of quantitative sequence stratigraphy based on stratigraphic forward modeling is tested on carbonate sedimentary systems (CSSs), especially on shallow-water carbonate platforms. Unless clear three-dimensional (3-D) and two-dimensional stratigraphic geometries crop out or are imaged by seismic data, 3-D carbonate sequence stratigraphic architectures are reconstructed assuming that one single factor representing changes in the ratio of the accommodation rate and the sedimentation rate (A′/S′) through time can describe complex 3-D carbonate stratigraphic architectures at the basin scale. In this work, it is demonstrated that despite using a unique accommodation curve and a time-constant carbonate production, the preservation of theoretical A′/S′, regarded as the fundamental parameter of sequence stratigraphy, is incomplete and spatially variable throughout a simple carbonate platform stratigraphic architecture. The apparent A′/S′ sequence stratigraphic parameters preserved in the stratigraphic records are distinguished from the actual A′/S′ parameters that control the stratigraphic response of CSSs. During overall accommodation increase, prograding and retrograding geometries can be time equivalent, whereas coeval shallowing- and deepening-upward sequences may form. Apparent A′/S′ spatial trends in one dimension are not consistently correlated between proximal and distal locations and do not typify specific stratigraphic architectures. This is the direct consequence of the spatial and synchronous variations in carbonate production rates along the platform profile. These results indicate that the construction of carbonate sedimentary piles, including carbonate reservoirs, cannot be simply based on standard sequence stratigraphic correlations of sparse and distant locations along platform-to-slope sedimentary profiles. Limitations of sequence stratigraphic correlations and uncertainties of A′/S′ rates are addressed from an actual CSS case study (Lower Cretaceous Urgonian platform, southern Provence, France). A quantitative carbonate sequence stratigraphic workflow based on stratigraphic forward modeling is proposed.
INTRODUCTION
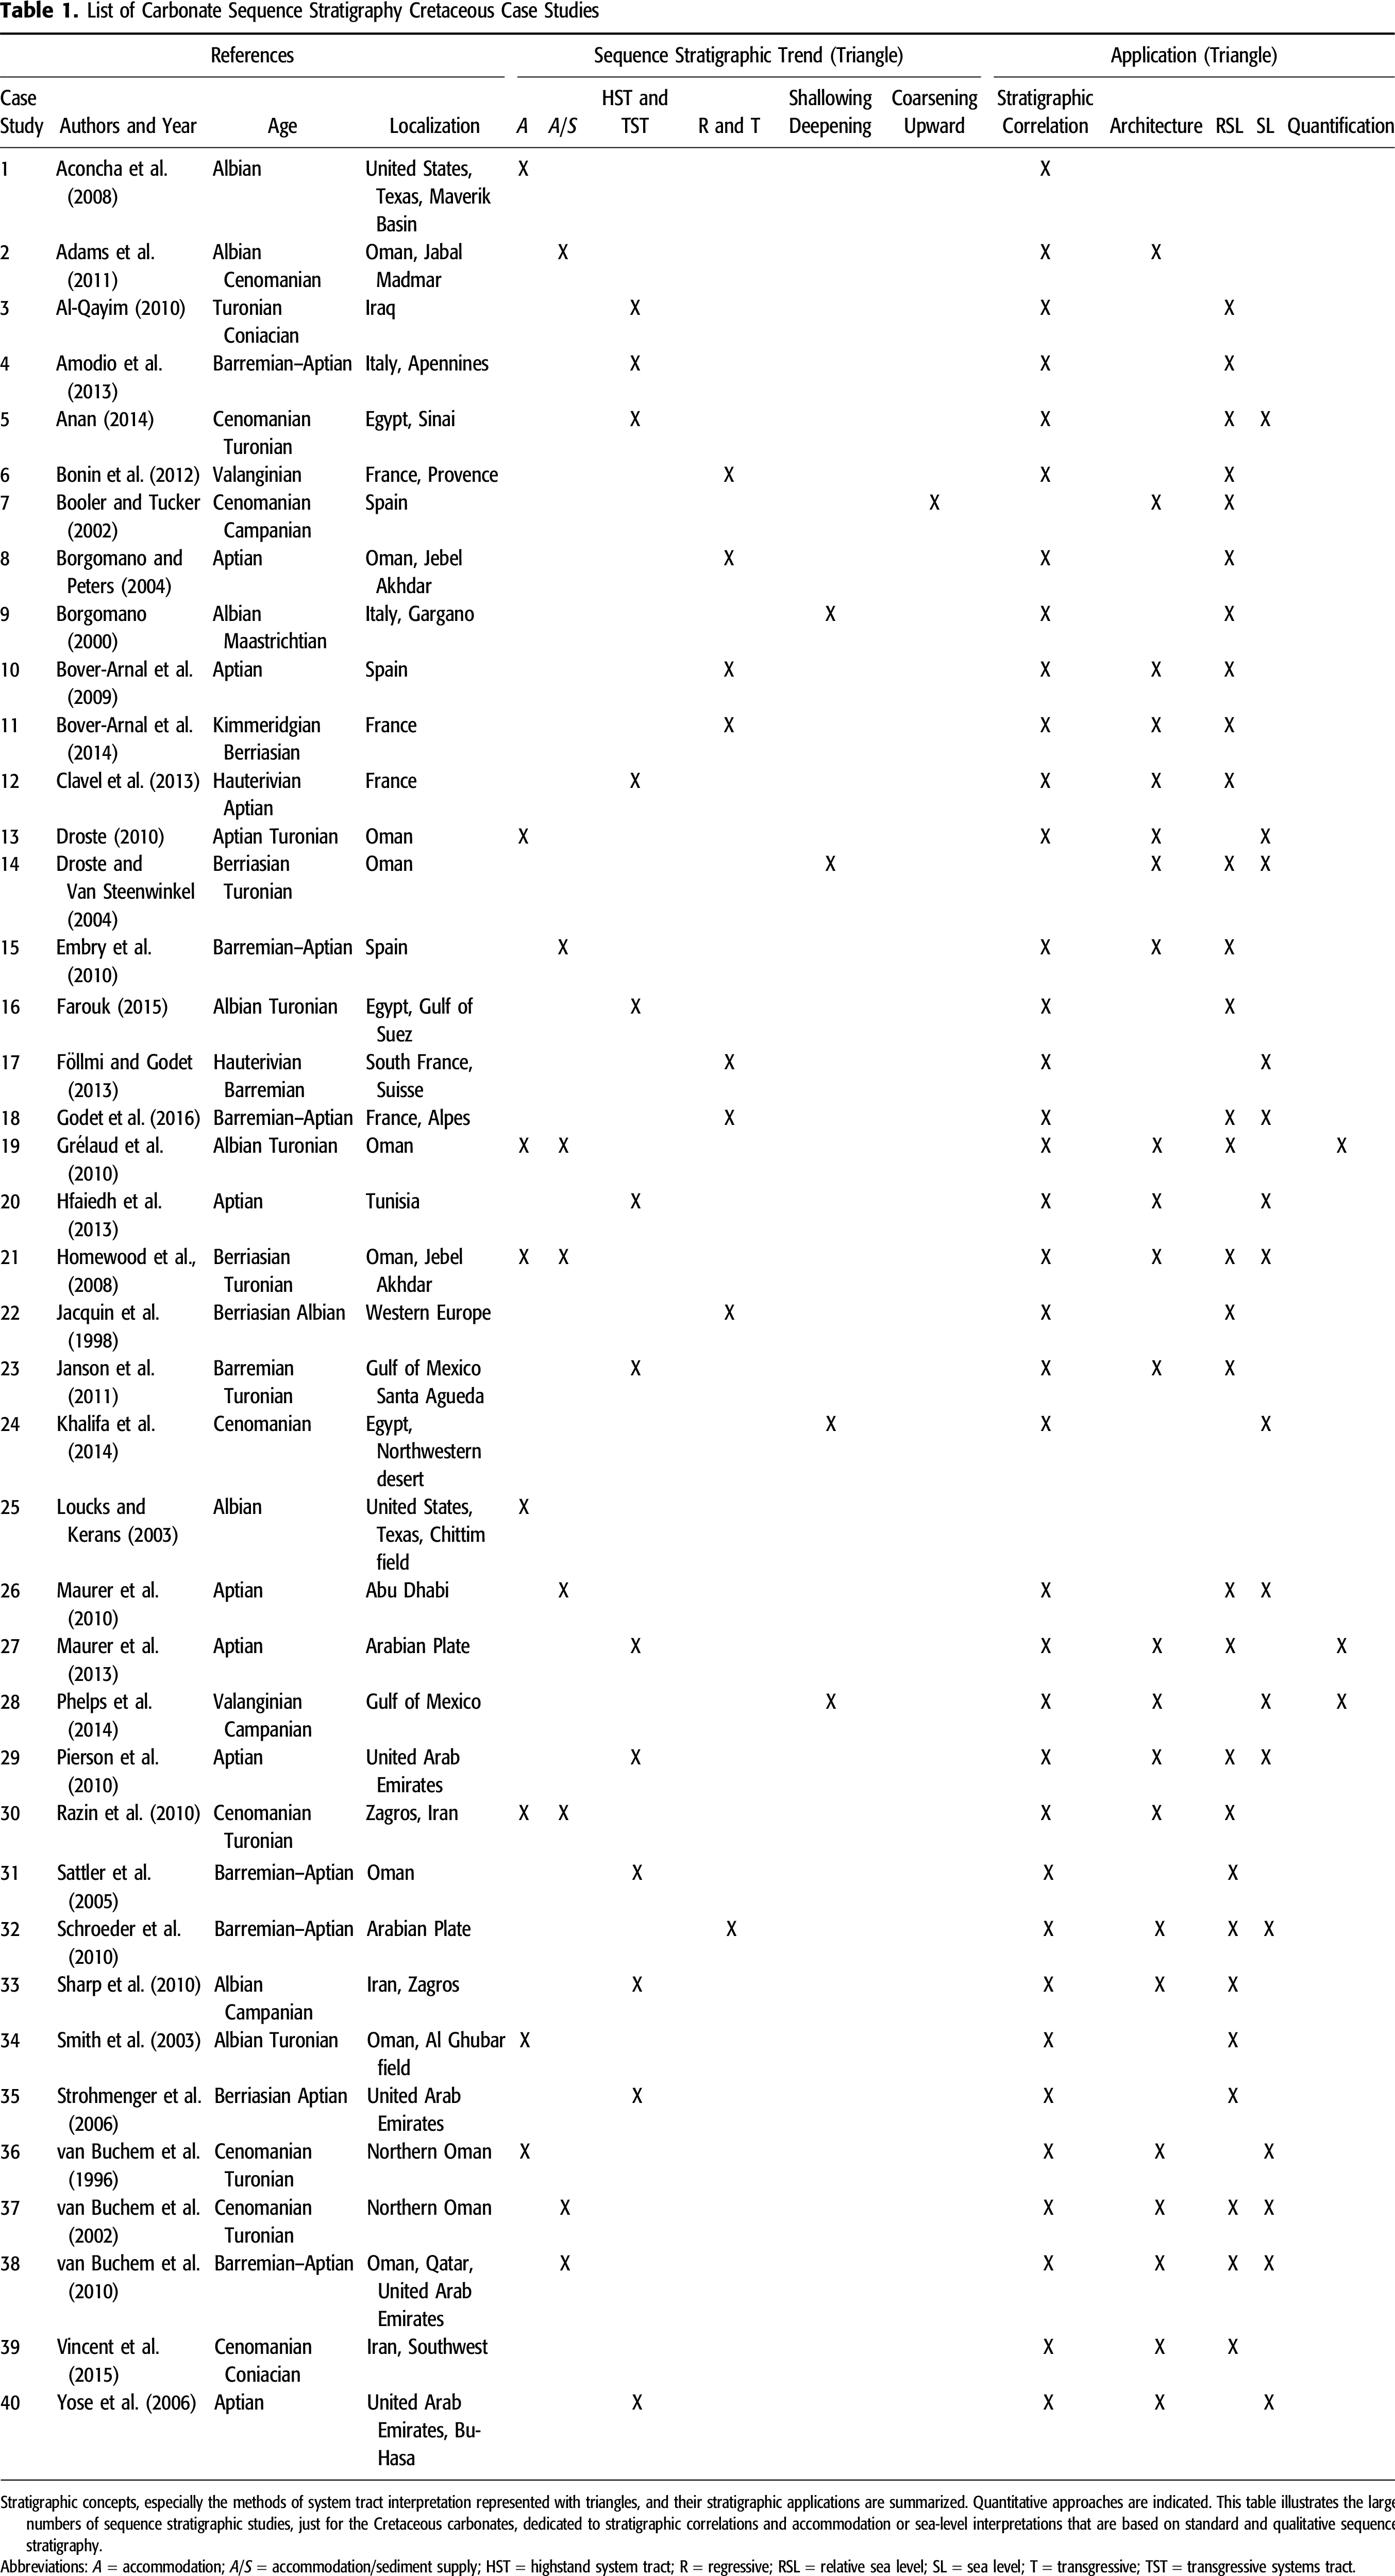
Sequence stratigraphic methods (e.g., Vail et al., 1977; Catuneanu, 2006; Neal and Abreu, 2009) have been applied for studying shallow-water carbonate sedimentary systems (CSSs) in academia and the petroleum industry since the 1980s (e.g., Sarg, 1988; Handford and Loucks, 1993; Schlager, 1993, 2005; Pomar and Ward, 1995; Eberli et al., 2004; Simmons et al., 2006; Phelps et al., 2008, 2014; Droste, 2010; Maurer et al., 2013; Qayyum et al., 2015; Pomar and Haq, 2016). They have been used to establish stratigraphic correlations between distant locations within sedimentary basins to analyze sea-level and climatic changes, subsidence, and environments of deposition during the Phanerozoic (e.g., Sonnenfeld and Cross, 1993; Sharland et al., 2001; Embry et al., 2010) and to support reservoir modeling (Borgomano et al., 2008). In this paper, the general carbonate sequence stratigraphic concepts (Catuneanu et al., 2011) and their application to stratigraphic correlations of sparse data (Table 1) are discussed. The subsequent construction of carbonate stratigraphic architectures can be considered to be one of the most significant predictive elements of carbonate sequence stratigraphic models, especially in subsurface and reservoir modeling. The limitations of these sequence stratigraphic models are analyzed, and a quantitative approach based on stratigraphic forward modeling is proposed. An important aspect of this paper is the introduction of stratigraphic forward modeling to interpret sea-level changes and subsidence rates from carbonate sedimentary archives and to estimate how much actual accommodation parameters are preserved in the sedimentary records. The overall objective of the paper is to propose a coherent quantitative method allowing the validation of carbonate sequence stratigraphic interpretations and correlations.
Theory of Carbonate Sequence Stratigraphy
Despite some important misconceptions and controversies (Miall and Miall, 2001), mainly rooted in semantics and misunderstandings (cf. discussion in Catuneanu et al., 2009), sequence stratigraphy is considered to be an essential stratigraphic method for interpreting and predicting CSS at global-to-local scales. Although the purpose of this paper is not to compare carbonate and siliciclastic sequence stratigraphy, it is important to keep in mind that carbonate sedimentary fluxes are controlled by complex interactions between benthic and pelagic communities and sediment in ecosystems that evolve through time and space (i.e., Schlager, 2005; Pomar and Haq, 2016). The impact of the different carbonate-producing ecosystems on sequence stratigraphic architectures, which has been recognized by various authors (e.g., Masse and Montaggioni, 2001) and extensively discussed by Pomar and Haq (2016), is not the subject of this paper. Sequence stratigraphy provides a theoretical frame to analyze carbonate stratigraphic records, identify critical stratigraphic surfaces, and invert, from stacks of carbonate rocks, basin-to-global parameters, including sea level, subsidence, paleobathymetry, sedimentary fluxes, accommodation and sedimentary rates, or depositional processes. Its popularity, especially among petroleum geologists, is rooted in its perceived simplicity, correlating regressive–transgressive cycles interpreted from single core, log, or outcrop data, combined with a simple mathematical construction, which can explain complex three-dimensional (3-D) carbonate stratigraphic architectures from only two parameters: accommodation and sedimentary flux, commonly simplified to accommodation only (Burgess and Prince, 2015). This classical approach has been applied at reservoir, regional, and global scales on a variety of CSSs, for example, on Lower Cretaceous carbonate platforms (e.g., van Buchem et al., 1996, 2011; Razin et al., 2010). Generally illustrated in one dimension (1-D) or in two dimensions (2-D), it describes physical processes that operate in 3-D space and can be expressed by the following equations (e.g., Homewood et al., 2000):
where A(t), SL(t), and Sub(t), respectively, represent accommodation, sea level (eustasy), and subsidence at a given time (t), and they are measured relative to a permanent datum.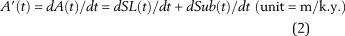
where A′(t) is the rate of change in accommodation (Schlager, 1993) or accommodation development (Ainsworth et al., 2018) that corresponds to the time derivative of the accommodation.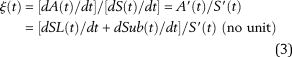
where ξ(t) is the sequence stratigraphic ratio, S(t) is the cumulative sediment thickness, and S′(t) is the sedimentation rate corresponding to the time derivative of S. It is simply the ratio of the accommodation rate and sedimentation rate (A′/S′); these rates are directly interpreted from stratigraphic system tracts. In practice, complex 3-D carbonate stratigraphic architectures are described by vertical sequence stratigraphic trends (third- and fourth-order stratigraphic sequences, Vail et al., 1977), interpreted in 1-D and represented by triangles (e.g., Homewood et al., 2000; Catuneanu et al., 2011) (Figure 1). These triangles can have several meanings depending upon the authors (Table 1); however, in theory, they represent regressive and transgressive trends, respectively, when A/S is less than 1 and A/S is greater than 1. These regressive and transgressive trends are correlated spatially and transformed into accommodation or relative sea-level (RSL) (e.g., Droste and Van Steenwinkel, 2004; Homewood et al., 2008; Pierson et al., 2010; Bover-Arnal et al., 2014) changes versus time, further interpreted as sea-level, eustatic changes (i.e., van Buchem et al., 2011). Generally, these carbonate stratigraphic sequences are defined from the stacking patterns of sedimentary sequences and combined with the identification of critical stratigraphic surfaces corresponding to sequence boundaries (e.g., Schlager, 2005) or maximum flooding surfaces (MFSs) (Catuneanu et al., 2009). Unless laterally continuous and extensive 3-D and 2-D stratigraphic geometries are exposed (i.e., Miocene Mallorca in Pomar and Ward, 1995; Permian Capitan Reef in Tinker, 1998) or imaged by seismic images (i.e., Cenozoic Maldives in Belopolsky and Droxler, 2004), interpreting carbonate sequence stratigraphic architectures can be very sensitive to deterministic stratigraphic correlations, dating, and sedimentary profile hypothesis (Borgomano et al., 2008; Lallier et al., 2016). Without the support of continuous outcrops or seismic images, 3-D reconstructions of carbonate sequence stratigraphic architectures are based upon the principle that one single signal, representing changes in A′/S′ through time and RSL, can describe complex 3-D carbonate stratigraphic architectures at the basin scale (Catuneanu et al., 2011). It implies that the preserved patterns of carbonate stratigraphic architectures (e.g., prograding, aggrading, and retrograding) are correlated with a single A′/S′ and RSL time curve. This assumption is implicit in the general sequence stratigraphic concept that describes 3-D carbonate stratigraphic architectures by A′/S′ time evolution of one single point (Homewood et al., 2000; Catuneanu et al., 2011). This convenient approximation is founded, but rarely discussed (Burgess, 2001, 2016), on two implicit hypotheses: first, that sedimentary flux (carbonate production) and accommodation rates are uniform within a given carbonate system; second, that A′/S′ parameters preserved in the stratigraphic records in the 3-D space match the theoretical A′/S′ parameters and control the evolution of the carbonate stratigraphic system.
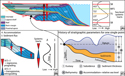 Figure 1. General concepts and principles of carbonate sequence stratigraphy. (A) Sequence stratigraphic architecture and main stratigraphic surfaces for a complete cycle of sea-level increase and decrease. Sequence boundary (SB), maximum flooding surface (MFS), transgressive surface (TS), highstand system tract (HST), lowstand system tract (LST), transgressive system tract (TST), and falling stage system tract (FSST). This unscaled conceptual scheme implies that a unique curve of sea-level system tracts in time and a unique thickness trend of regressive and transgressive tracts (triangles) can explain the two-dimensional stratigraphic architecture (modified from Catuneanu et al., 2011). (B) Correlation between system tracts, accommodation, and sedimentary flux (modified from Homewood et al., 2000). (C) History of stratigraphic parameters for one single point in the sedimentary basin (modified from Homewood et al., 2000).
Synchronous Deepening-Upward and Shallowing-Upward Sequences
To minimize stratigraphic uncertainties related to interpolations and correlations between distant locations, relevant stratigraphic investigations have been carried out on spatially continuous carbonate outcrops such as the Urgonian platform (Lower Cretaceous) in southeastern France (Richet et al., 2011; Léonide et al., 2012), aided by numerical mapping and digital outcrop modeling methods. Several high-resolution stratigraphic dip-transects (3–20 km long) have been surveyed from the inner to outer platform and to the outer-shelf environments, resulting in the continuous mapping of stratigraphic sequences and surfaces (Figure 2). These studies have clearly demonstrated that even in a spatially stable subsidence regime, inner-platform shallowing-upward sequences, capped by exposure surfaces, are synchronous and are able to be correlated with outer-platform deepening-upward sequences in less than a few kilometers along depositional dip (Figure 2A, B; Léonide et al., 2012). The synchronous evolution of the carbonate production along the sedimentary profile can be the cause of this apparent stratigraphic paradox. A subsequent challenge is to transform such an opposite sequence stratigraphic trend into a unique RSL curve in time that can be used for stratigraphic correlation purposes (Figure 2D). This procedure relies on several critical assumptions regarding the time–thickness relationships, duration of stratigraphic hiatuses, depositional rates, and environmental parameters (e.g., bathymetry). This stratigraphic inversion problem is amplified by the nonuniqueness of sequence stratigraphic models recently discussed by Burgess and Prince (2015). It is exacerbated in CSSs by highly variable carbonate production rates in time and space, these rates not necessarily being correlated with accommodation (Masse and Montaggioni, 2001; Pomar and Haq, 2016).
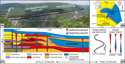 Figure 2. Sequence stratigraphic interpretation of a laterally continuous carbonate outcrop, Early Cretaceous platform in Provence (La Nesque Canyon, southeastern France). Inner-platform sequences with rudists, often capped by exposure surfaces and beach rocks, grade laterally to outer-shelf mudstone deposits with chert and ammonites toward the deeper Vocontian Basin. Opposite system tracts, shallowing-upward and deepening-upward sequences are correlated laterally, which questions the existence of unique relative sea-level curve and system tract in time. Given the uniform subsidence in this case, the differential carbonate production along the sedimentary profile can explain these opposite system tracts (see text for detailed explanations), thus questioning the classical practice of correlating system tracts from distant locations (modified from Léonide et al., 2012). (A) Eastern view of the La Nesque outcrop. (B) Location of the studied outcrop on a Barremian paleogeographical map, southeastern France. (C) High-resolution stratigraphy of the platform-to-basin transition. (D) Theoretical sequence stratigraphic trends in time domain.
Apparent and Actual Sequence Stratigraphic Parameters
Careful analysis of 40 published classical carbonate case studies (Table 1) indicates that stratigraphic parameters (accommodation, A/S, system tracts, shallowing–deepening upward, coarsening–fining upward) are not systematically interpreted from stratigraphic records and used for establishing stratigraphic correlations and architectural reconstructions. A single time curve of RSL (equivalent to accommodation curve), or even sea level, is subsequently established in all of these studies (e.g., Catuneanu et al., 2011) and applied to the entire CSS (Figure 1). This classical procedure is generally carried out without considering the spatial variability of carbonate production and without estimating the preservation signal of all controlling parameters in the sedimentary record (Miall, 2016). The confusion between “actual” (the effective controlling parameters) and “apparent” (the preserved signal in the rock) parameters in CSS is a likely source of misconception in carbonate sequence stratigraphy (Figure 3). For example, sea level, subsidence, or sedimentary flux (controlling parameters) are not preserved in sedimentary archives, unlike paleobathymetry, bed thickness, or porosity, which can be directly measured in the sedimentary rocks. Inverting a sea-level or accommodation curve from these archives implies assumptions, analyses, and calculations of various preserved parameters in the strata, such as paleobathymetry, bed thickness, or hydrodynamics. The preservation of parameters is not necessarily complete relative to the time duration, and single sets of preserved sedimentary parameters can be explained by several combinations of effective controlling parameters (Burgess, 2016). In stratigraphic time series, the difference between apparent and actual parameters is a function of hiatus duration (e.g., Burgess and Wright, 2003). This difference is expected to grow with increasing time hiatuses, resulting in significant misinterpretations of stratigraphic sequences, especially if they are not identified and quantified. Furthermore, as opposed to many scientific domains such as physics (e.g., Brynjarsdóttir and O’Hagan, 2014), this stratigraphic inversion method is rarely coupled to stratigraphic forward modeling methods for comparing predictions and observations and for estimating model discrepancies (Burgess et al., 2001; Barnett et al., 2002; Burgess, 2006; Warrlich et al., 2008; Williams et al., 2011; Hill et al., 2012; Burgess and Prince, 2015; Montaggioni et al., 2015). To fill this critical methodological gap, one of the objectives of this paper is to test carbonate sequence stratigraphic concepts from synthetic cases with stratigraphic forward modeling methods and to investigate the relationships between actual and apparent stratigraphic signals (Figure 3).
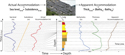 Figure 3. Space–time relationships between actual and apparent accommodation analyzed from a typical carbonate platform outcrop. Subsidence and sea-level curves that define the actual accommodation are expressed as a function of time, whereas the apparent accommodation, calculated from bed thickness and paleobathymetry, is expressed as a function of depth. Without strong assumptions on the time–depth function, it is difficult to extract the actual accommodation time curve directly from such sedimentary records. Facies legend in Figure 2. Bathy = Bathymetry; t0 = 0 m.y.; tn = 5 m.y.
METHOD DATA
Numerical Sequence Stratigraphic Parameters
The general principle of our approach lies in the analysis and quantification of carbonate sequence stratigraphic parameters by means of stratigraphic forward modeling tools (e.g., Dionisos; Granjeon, 1997; Granjeon and Joseph, 1999). Actual basin parameters (sea level, subsidence, carbonate production, and initial topography) are estimated from key sites of Lower Cretaceous platforms in southeastern France (Figure 2) (Léonide et al., 2012; Tendil et al., 2018) and the Middle East (van Buchem et al., 2002; Yose et al., 2006). The carbonate production parameters for the different environments of the platform (Figure 4) are consistent with previous quantitative studies on CSS (Schlager 1981, 2010; Enos, 1991; Bosscher and Schlager, 1992; Sadler, 1994). These parameters are tested using the stratigraphic forward modeling tool, thus allowing the realization of numerical carbonate stratigraphic grids (Figure 4). With this method, the actual parameters used as inputs to the model (i.e., sea level or subsidence, accommodation, carbonate production) are assumed to be known and can be compared to the preserved parameters as defined in the simulation. The spatial and time correlations of the preserved, apparent A′/S′ signals can be analyzed numerically because many stratigraphic and environmental parameters are computed and preserved in the numerical grids (i.e., bathymetry, rate of sedimentation). This method allows for preserved, apparent A′/S′ changes at all locations of the stratigraphic models to be quantified and for them to be compared with actual A′/S′ parameters, which are inputs to the model (Figure 4A). Sequence stratigraphic parameters, including accommodation, hiatuses, bathymetry trends, sedimentation, and erosion rates, are extracted from the modeled numerical stratigraphic grids; this is commonly done from real outcrop or subsurface examples (Figure 3) according to the following equations:
where Ã(t) is the apparent accumulated accommodation, computed from the values of accumulated sediment thickness,  (t), and paleowater depth, B(t). The water depth at simulation time 0, B(0), is subtracted from the sum of
  (t) and B(t) to remove the effect of the initial bathymetry on the calculation of the apparent accommodation.
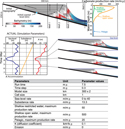 Figure 4. Two-dimensional stratigraphic forward model of a carbonate platform during 7.5 m.y. The model length is 300 km with an initial ramp topography and a slope angle less than 0.1°, thus mimicking typical Cretaceous Tethysian carbonate platforms. Subsidence is uniform in time and space (100 m/7.5 m.y.), and sea-level changes correspond to a sinusoid with long periods and mean amplitudes (20 m). Carbonate production, constant through time, is the only input parameter that varies in space as a function of water depth and energy.
The apparent rate of change in accommodation (unit = m/k.y.) is defined as follows:

where  is the apparent sequence stratigraphic ratio and
  (t) is the apparent sedimentation rate, defined as the change in sediment thickness with time.
The apparent sequence stratigraphic ratio is computed at any location of the modeled stratigraphic grid (Figure 5). This property can also be displayed as a curve (Figure 6) and analyzed in 2-D in the stratigraphic grid. Through this approach, which touches upon one of the pillars of carbonate sequence stratigraphy, it is possible to estimate the differences, if any, between theoretical A′/S′ (equations 1–3) and apparent stratigraphic sequence ratio (Ã′/ ) (equations 4–6) and between theoretical accommodation and apparent accommodation.
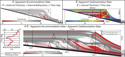 Figure 5. Apparent sequence stratigraphic parameters calculated from the carbonate platform stratigraphic forward model (cf. Figure 3). Apparent sequence stratigraphic parameters, A′ (A) and S′ (B), are calculated from water depth and sediment thickness (cf. Figure 1C) in all locations of the stratigraphic grids. Despite uniform accommodation (in space) and constant carbonate production (in time), the A′/S′ ratio (C) is not constant within the individual time interval, and this is the direct consequence of the lateral changes in apparent sedimentation rates, expressed by the thickness variation of the strata.
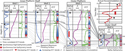 Figure 6. Proximal-to-distal correlation panel of pseudowells, with curves of water depth and apparent sequence stratigraphic parameters calculated from the modeled stratigraphic grids (Figures 4, 5). Time lines correspond to the simulated layers in the stratigraphic grid. Triangles represent apparent accommodation rate and the sedimentation rate (A′/S′) trends, decreasing or increasing. All the curves can be compared to the real accommodation curve in the upper right caption. This panel intends to mimic stratigraphic well correlation in space domain and illustrate the erratic time correlation of apparent parameters (bathymetry, A, and A′/S′) and system tracts (triangles). The actual accommodation signal in time is well preserved (as expected) in the distal and deeper domain, with no hiatus and stable sedimentation rates. See detailed explanations in the text.
It is important to notice that hydrodynamics and complex sediment transport processes are not simulated in this study. A weak, basinward, long-term transport of sediment is simulated with the Dionisos diffusion equation according to the slope gradient (Granjeon, 1997). This approach, coupled to variable production rates dipwise, provides a good approximation of the downdip transfer of carbonate sediments given the following modeling hypotheses (Figure 4): (1) the long duration (300 k.y.) of each calculation time step, and (2) the important extension (300 km) of the sedimentary profile and the large size (1 km2) of the individual cells. Both hypotheses imply that the sedimentary profile reaches equilibrium at each calculation step. Sensitivity tests have been done with smaller grid cells and time steps. This has no impact on the stratigraphic analytical results at the scale (time–space) of the modeled CSS. Water energy (waves, tidal currents, alongshore currents, and internal waves) is an important factor for the preservation and transfer of carbonate sediments in shallow-marine settings (e.g., Reijmer et al., 2009; Pomar et al., 2012; Eberli, 2013; Purkis and Harris, 2017). The hydrodynamical impact on apparent A′/S′ will therefore be considered and tested in further work at much higher resolution (time–space) and from much smaller CSS models.
Stratigraphic Forward Modeling
This modeling workflow is applied to a simple carbonate platform (300 km long dipwise) that is characterized by smooth and low-gradient initial topography with a slope angle of 0.1°, thus mimicking carbonate ramps that developed on Tethyan passive margins. Carbonate production, which is constant in time, varies according to bathymetry; only a single accommodation curve (i.e., RSL curve) is applied to the entire model (Figure 4). This model intends to mimic the long-term and basin-scale evolution of a typical Early Cretaceous Tethyan carbonate platform as developed, for example, in the Middle East (Sharland et al., 2001). The subsidence uniform in time and space (100 m/7.5 m.y.) was set according to the minimum values measured in typical Cretaceous passive margin settings around the Tethys (Borgomano, 2000). Sea-level changes correspond to a sinusoid with long periods (1 m.y.) and mean amplitudes (20 m) that includes a well-marked lowstand (−80 m) between 4.5 and 3 Ma. Carbonate production, which is constant through time, is the only input parameter that varies in space as a function of water depth and energy. The spatial variations of carbonate production rates are typically those of a ramplike platform with a gradual transition to a deeper environment (300 m). The choice of carbonate production rates in stratigraphic forward modeling is contingent on the simulation time increment (Schlager, 2005), which is set to 300 × 103 yr. Decreasing the duration of the time increment would have implied higher production rates but conversely higher erosion or dissolution rates. In the simulation, carbonate production must mimic the theoretical carbonate sedimentary profile as resulting from sediment production, erosion, and transport: although strong rates of production operate in shallow water depth (0–10 m), the rates exponentially decrease with an increase in water depth, finally leveling out to zero between 50 and 100 m deep. Simulation parameters are detailed in Figure 4.
RESULTS
Figure 4 shows the resulting stratigraphic architecture together with the water–depth properties. The design is characterized by contemporary coastal onlaps, aggrading and prograding trends, which result from the interplay between in situ carbonate production, accommodation changes, and sediment diffusion. Two aggrading–prograding intervals are separated by a lowstand wedge during which the entire platform domain is exposed. This wedge is forced by a sea-level drop of 40 m not compensated by subsidence at an age of 4.2 Ma. The position of the lowest sea level (3.6 Ma) is well marked by a small step on the edge of the lowstand. Coastal onlaps over the initial topography, caused by increasing accommodation, are synchronous with platform-building aggradation and progradation events. The highest rates of accommodation increase from 3.5 to 2.5 Ma after the sea-level drop and prevent the strong progradation of the platform in comparison to the interval below the lowstand. In the two aggrading intervals, strata of variable thicknesses, which are commonly exposed, apparently track the high-frequency and low-amplitude accommodation cycles. It is important to notice that the discrepancies observed between the two stratigraphic architectures, before and after the deposition of the lowstand wedge, are related to the two different intermediary depth profiles, which are not controlled by the uniform accommodation. Four pseudowells are located along the profile from the inner platform to the outer shelf. Because they are not situated updip of the initial coastline, all wells sample the complete stratigraphic interval, showing no hiatus related to the initial coastal onlap.
The modeled stratigraphic grid is postprocessed according to equations 4–6. Input parameters are bathymetry and thickness simulated in each of the cells of the time layers in the stratigraphic grids (Figure 5). Apparent accommodation rate (Ã′), sedimentation rate ( ), and Ã′/
 are computed as new properties for each time layer and displayed in the stratigraphic grid. The Ã′/
 curves extracted from the grids at specific locations (pseudowells) are plotted along with bathymetry and the time–depth curve (Figure 6). Depth trends of Ã′/
 (decreasing, increasing, or constant) are illustrated in the pseudowell logs as overlays on the stratigraphic grids. The modeled stratigraphic grid allows the comparison between the actual time lines, apparent Ã′/
 trends, bathymetry curves, and stratigraphic architectures in the depth domain. In the stratigraphic grids, the polarity of the Ã′/
 depth trends shifts laterally in the lower prograding interval dominated by an apparent increase of Ã′/
 becoming greater than 1 (Figure 6). The bathymetry and Ã′/
 curves are not systematically correlated with the accommodation or sea-level curves except in the outer-shelf domain (well 4) and in the uppermost aggrading interval characterized by layers with laterally constant thickness (Figure 6). In the outer-platform and outer-shelf domains, synchronous intervals of shallower bathymetry and lower Ã′/
 record the drastic sea-level drop at 4 Ma. Two peaks of high sea level and accommodation (0.6 and 5.5 Ma) are expressed in most locations but are not associated with maximum Ã′/
 values. Only one time line in the uppermost interval corresponds to the precise correlation of Ã′/
 trends and bathymetry curves in all locations (Figure 6).
DISCUSSION
Examination of the simple carbonate stratigraphic model in Figure 3 indicates that the preservation of actual A′/S′, one of the fundamental parameters of carbonate sequence stratigraphy (equations 1–3), is partial and not uniform across the stratigraphic architecture (cf. Schlager, 1993). Despite the unique accommodation curve and the time-constant carbonate production, calculated Ã′/ (equations 4, 5), regressive or transgressive trends, and progradational or retrogradational trends cannot be simply correlated within the stratigraphic architecture (Figures 5, 6) as practiced commonly in academia and the industry (e.g., Read, 1998; Kenter et al., 2002; van Buchem et al., 2002; Borgomano et al., 2008; Moore and Wade, 2013). Given the space constant accommodation, this is the direct consequence of the lateral and synchronous variations of the apparent sedimentation rates in the model (Figure 5B) integrating carbonate production, erosion, and transport processes as explained in the modeling method.
Variations of Apparent Accommodation and Sedimentation Rates in Time and Space
Being that the calculated accommodation rates are constant for most time layers (Figure 5A), it is the significant lateral thickness changes of the prograding outer-platform layers that explain the lateral variations of apparent Ã′/ trends and values (equation 6). Despite constant theoretical accommodation changes in space and constant theoretical sedimentation rates in time, the spatial variations of in situ carbonate production (relative to water depth) control the variations of apparent Ã′/
 in time and space. During this overall spatial increase of accommodation, thicker prograding outer-platform intervals result in an apparent decrease of Ã′/
 toward negative values, whereas the thinner aggrading intervals of the inner platform and outer shelf correspond to a synchronous increase of Ã′/
 toward positive values (Figure 5). To the contrary, in the upper aggrading interval, Ã′/
 ratios greater than 1 are intercorrelated along the sedimentary profile as a result of the laterally constant sedimentation rates and strata thickness. In general, negative Ã′/
 values are more common in outer-platform and outer-shelf domains than in the inner-platform domain. This is because decreasing accommodation trends are recorded by sedimentation in deeper domains in contrast to the inner domain where only periods of increasing accommodation episodes are recorded. This model clearly illustrates that the spatial variation of in situ carbonate production alone can disturb the linear record of apparent single Ã′/
 signal in time and space, as observed from continuous carbonate outcrops (Léonide et al., 2012) and already interpreted from CSS by a few authors (Schlager, 1993; Masse and Montaggioni, 2001). Correlating calculated Ã′/
 trends and synthetic stratigraphic architectures (Figure 6) representing simple CSS is not as straightforward as presented in theory (Figure 1). The carbonate sequence stratigraphy theory predicts, to the contrary, that a unique A/S signal can represent a complex stratigraphic architecture from distal to proximal settings (Figure 1). This principle is, in turn, applied for correlating carbonate stratigraphic sequences and reconstructing complex carbonate stratigraphic architectures from sparse and distant data (e.g., van Buchem et al., 1996, 2002; Droste, 2010; Janson et al., 2011) and for correlating carbonate stratigraphic systems at a global scale (e.g., Embry et al., 2010).
Preservation of the Ratio of the Accommodation Rate and Sedimentation Rate Signals
In the more distal location (well 4), where the apparent Ã′/ curve is tracking the accommodation and sea-level curves, the time–depth relationship is linear (Figure 5). Stratigraphic hiatuses and exposure surfaces are not recorded in this distal and deeper location, indicating that accommodation and sea-level changes have been registered continuously by the sedimentation: the deeper carbonate accumulation rate is too low to exceed the accommodation and fill the available sedimentary space up to sea level, and even during the lowstand episode, the water depth is greater than 50 m, reflecting deep initial bathymetry, weak carbonate production, and accommodation increase. By contrast, in the more proximal and shallower domain (well 1), exposures and stratigraphic hiatuses are frequent: shallower carbonate production exceeds accommodation and fills the available sedimentary space up to sea level, and shallow bathymetry (<10 m) cannot accommodate sea-level drops. The intermediary outer-platform domain (well 3), subjected to minor exposures and associated hiatuses, accommodates the complete development of the lowstand wedge and associated exposures. This domain is characterized by prograding geometries and significant lateral thickness changes; the sloping geometry and bathymetry window (0–100 m) activate the complete range of carbonate production along the sedimentary profile and accommodate the falling sea level (Figure 4). Highest and laterally constant apparent Ã′/
 values are associated with a unique thin layer (3 Ma), which form the base of the aggrading platform interval above the lowstand wedge. This layer could be picked on apparent Ã′/
 depth trends as an MFS (Figures 5, 6). However, it does not match the maximum bathymetry, accommodation, or sea level of the model (0.5 Ma; Figure 6) according to the definition of the MFS (Posamentier and Allen, 1999). In contrast, this interval represents the time-correlated highest apparent Ã′/
 value of the model when the rate of accommodation increase is maximum and exceeds the carbonate production rate. Inversion and correlation of sequence stratigraphic signals from CSS rely therefore on the analysis of the preserved time–depth function (Miall, 2016), which cannot be done without the support of modeling tools.
Preservation of the Accommodation Rate Signals
The second part of the workflow consists of applying a “stratigraphic preservation function” to compare actual and apparent sequence stratigraphic parameters (Figures 7, 8). The objective is to analyze the preservation state of the real accommodation parameters, that is, the inputs to the model (sea level and subsidence), in the modeled stratigraphic grids. This comparison is realized in a Wheeler diagram (Figure 7). Approximately 50% of the space–time domain of the Wheeler diagram comprises domains with weak (0–5 m) or strong (−30 to 30 m) differences between actual and apparent accommodation. The stronger difference can represent 100% of the real accommodation, whereas the weaker difference reaches a maximum of 16%. In the proximal domain, the stronger differences result from the hiatus in deposition associated with the coastal onlap of the platform onto the initial topography. Above the lower platform interval, the stronger differences observed are the consequence of platform exposure during the lowstand episode. It should be noted that the basinward boundaries of this space–time domain correspond to the shelf break of the first platform interval. Weaker differences between actual and apparent accommodations are concentrated in a relatively narrow band of 15–25 km between the shelf edge and the upper slope in all three platform intervals. These weaker differences occur in all the isochronous layers in the zone where the polarities of apparent sequence stratigraphic trends are shifting (Figure 5C) and where the apparent sedimentation rates are maximum (Figure 5B). Such a Wheeler diagram, which displays the difference between actual and apparent accommodations, allows the space–time domains to be identified, in which the actual accommodation signal (a single curve in this case) is fully preserved (mainly aggrading platform and basin segments). Figure 8 compares, as a function of time, the calculated apparent accommodation and the actual accommodation curve in particular locations along the sedimentary profile. In the case of no compaction, calculated cumulative apparent à curves are realistic in the distal domains (outer platform and outer shelf, wells 3 and 4) where emersion and hiatuses are rare. They exhibit short cycles and long-term trends including lowstand phases. In the proximal domain (wells 1 and 2), the A curves mainly represent the long-term trend without the short cycles and the lowstands. This confirms that the interpretation and the correlation of apparent à and Ã′/ curves from shallow-water carbonate systems (inner–outer platform) can be misleading because of the nonpreservation or incomplete records of lowstand episodes combined with overfilling of accommodation spaces. Estimates of apparent Ã, however, can be realistic in deeper and distal domains where sedimentary records are more complete and continuous.
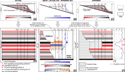 Figure 7. Comparison between actual and apparent accommodations calculated from the modeled stratigraphic grids in space and time domains (Wheeler diagrams). (A) Actual accommodation in space; (B) difference between actual and apparent accommodation in space. Only small differences (<15%) are calculated on the platform edge. (C) Apparent accommodation; (D) actual accommodation in time and space (Wheeler diagram). The values are constant in space for each of the time intervals (the model is realized with one accommodation curve). (E) Difference between actual and apparent accommodations in space and time (Wheeler diagram). The difference between the two parameters is maximum in the platform domain in relation to the stratigraphic hiatuses (lowstands and coastal onlaps). (F) Apparent accommodation in time and space domain (Wheeler diagram).
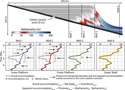 Figure 8. Comparison between actual and apparent accommodation curves in time, calculated from the modeled stratigraphic grids in the pseudowell locations. This figure illustrates precisely that mismatches between the two parameters correspond to lower accommodation cycles and subsequent hiatuses in the inner-platform domain. The actual amount of negative accommodation is not systematically recorded in locations where the accommodation is filled by carbonate production. t0 = 0 m.y.; tn = 5 m.y.
Carbonate Sequence Stratigraphy in Practice
Commonly, outcrop or subsurface carbonate sequence stratigraphic models are based on the general principle that a single and unique A′/S′ signal can be correlated throughout the investigated sedimentary systems, assuming the A′/S′ single signal is representative of the 3-D stratigraphic architecture (Figure 1). This problem was already addressed in standard papers (e.g., Schlager, 2005) but systematically ignored by a majority of studies, in particular on carbonate-producing fields that have probably introduced major errors in static reservoir models (cf. Borgomano et al., 2008). Table 1 includes a reference list of case studies of Cretaceous carbonates, showing that this principle (unique A′/S′ signal correlated throughout the CSS) is generally applied to reconstruct 2-D and 3-D carbonate stratigraphic architectures from distant and sparse stratigraphic sections (outcrops or wells). In these studies, sequence stratigraphic trends or sequences, represented by triangles, have different meanings depending on the authors: regressive or transgressive, A′/S′, bathymetry, accommodation, or sea level. Despite their different meanings, these sequences are interpreted as sedimentary stacking patterns and are intercorrelated to build a time frame for the facies distribution and the construction of carbonate stratigraphic architecture according to sequence stratigraphic principles (e.g., Droste, 2010; Maurer et al., 2010; Razin et al., 2010; Catuneanu, 2017). Similarly, A′/S′ trends are also used for correlating carbonate systems at the global scale (Embry et al., 2010). In this approach, A′ and S′ are systematically not quantified and identified (Table 1), and the interpreted A′/S′ trends amount, in practice, to an estimate of false (according to our definition in Figure 3) apparent Ã′/Š′ trends preserved in the sedimentary records, including water depth, hydrodynamics, and ecological or deposition trends. The correlations of these false apparent Ã′/ trends, at a local or global scale, are generally based on the implicit assumptions that they are correlated to sea-level (eustasy) changes (Sharland et al., 2001). The common practice of using RSL instead of accommodation or “3-D accommodation” in the interpretation of sequence stratigraphic successions makes the conceptual jump easier from a change in volume trough time and space (3-D accommodation changes) to a unique curve of sea-level change. Such a critical assumption is even explicit in some Cretaceous case studies (Table1). Whether they are implicit or explicit, this hypothesis and the subsequent carbonate stratigraphic models are never validated with the support of quantitative approaches, including stratigraphic inversion or forward modeling. In the particular case of Barremian–Aptian carbonate systems discussed in this paper (Figure 2), the common practice is to interpret and correlate a single and unique RSL curve throughout the entire CSS (Table1). This sea-level curve is the foundation of most Barremian–Aptian carbonate sequence stratigraphic models (Table 1). This approach has a critical impact on the coeval 3-D reservoir models of hydrocarbon-producing fields, especially in the Middle East and on global paleoclimate and geodynamic reconstructions (Table 1).
We have previously demonstrated that even if carbonate production and accommodation are constant in time and space, respectively, the calculated apparent Ã′/ trends are not unequivocal across simple carbonate stratigraphic architectures and are not systematically intercorrelated. Rather than preventing the use of sequence stratigraphic correlations in carbonate systems, this important result must promote more quantitative sequence stratigraphic approaches to estimate the uncertainty range of the Ã′,
  , and Ã′/
 parameters interpreted from the stratigraphic record. We are, therefore, testing some simple stratigraphic inversion methods on the Barremian–Aptian Urgonian carbonates of the southeastern France basin based on well-constrained stratigraphic successions and laterally continuous outcrops where stratigraphic correlations are not ambiguous (Léonide et al., 2012).
In Figure 9, the paleobathymetry and thickness data are computed to estimate the apparent accommodation (equation 4) for each stratigraphic unit. This calculation is based on three explicit hypotheses: (1) the paleowater depths for each facies are estimated according to the sedimentary profile, ranging between a few meters to 100 m deep along the Urgonian platform (Léonide et al., 2012); (2) the lack of exposure surfaces (not identified in the outcrop); and (3) weak compaction neglected in the calculation. Initial bathymetry (time 0) is 5 m. Overall, this investigated succession corresponds to an outer-platform domain with relatively dense and deeper carbonate facies (Léonide et al., 2012) and with no evidence of inner-platform environments, which are typical of the Urgonian platform because meter-thick peritidal cycles are commonly punctuated by exposure surfaces (Masse and Fenerci-Masse, 2011). Sediment compaction has not been considered here for simplification purposes. Of course, this process can impact both the evolution of the paleobathymetry and the bed thicknesses. Accordingly, it needs to be carefully analyzed (i.e., Goldhammer, 1997). Calculated apparent accommodation for each unit is displayed as a cumulative curve with an uncertainty envelop related to the important paleobathymetry ranges. The broken shape of the curve and its apparent low vertical resolution are related to the significant thickness of individual stratigraphic units, which are associated with almost constant paleobathymetry and no gradual changes. This cumulative accommodation curve shows a general increasing-upward trend and several second-order sharp increases or decreases (Figure 9, curve 1). In all intervals, these apparent sharp changes do not exceed the uncertainty associated with the paleobathymetry estimates. Given our initial three hypotheses and without more precision on the paleobathymetry, it is, therefore, possible to consider that this typical outer-platform Urgonian succession is dominated by an overall increase in accommodation (dashed line in Figure 9) with highly uncertain positive or negative accommodation cycles. The dashed curve (accommodation 2) is a possible scenario of smoothed increasing accommodation, devoid of cyclic variations. This scenario falls within the uncertainty range. The smaller arrows indicate opposite vertical trends of accommodation in several intervals, ranging within the uncertainty values. This calculation shows that in thick, relatively deep outer-platform successions, where the water–depth uncertainty equals the bed thickness, it is not straightforward to interpret the real accommodation.
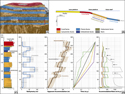 Figure 9. Estimation of apparent accommodation and accommodation rates from a real carbonate stratigraphic succession (modified from Léonide et al., 2012): Early Cretaceous carbonate platform in Provence (southeastern France), Le Rocher du Cire outcrop (A) (cf. location in Figure 2). Facies (B) and sedimentary sequences (C) correspond to outer-platform and outer-shelf environments and are dominated by bioclastic grainstones and wackestones with abundant cherts. Inner-platform facies and exposure surfaces are absent from this succession. Carbonate grain size: fine sand (f.), medium sand (m.), coarse sand (c.), gravel (g.). (D) Calculated sequence stratigraphic parameters (blue and brown shadings represent uncertainty ranges). The mean bathymetry curve is displayed with an uncertainty range, but sediment compaction is not considered. Cumulative apparent accommodation is calculated by considering the bathymetry uncertainties and the bed thickness. The mean curve (accommodation 1) corresponds to the mean bathymetry and displays an overall increasing trend and several cycles of accommodation decrease and increase. The dashed curve (accommodation 2) is a possible scenario of smoothed increasing accommodation, without cyclic variations, that falls within the uncertainty range. Smaller arrows indicate opposite vertical trends of accommodation in several intervals that fall within the uncertainty range. This simple calculation demonstrates that in thick, relatively deep carbonate successions, if the bathymetry uncertainty equals the bed thickness, it is not straightforward to interpret the real accommodation. Estimation of accommodation rates (and sedimentation rates), which are fundamental sequence stratigraphic parameters for interpreting system tracts, relies on a hypothetical and uncertain time–thickness function. Opposite vertical trends of the accommodation rate can be calculated in several intervals (horizontal arrows) depending on the time–thickness function. The colors of the accommodation rate curves correspond to the different the time–depth functions (graph on the left).
Going further in the sequence stratigraphic analysis of this vertical succession and interpreting regressive or transgressive trends (A′/S′) requires an assessment of the accommodation and sedimentation rates. Knowledge of apparent Ã′/ is fully dependent upon the time–thickness function applied to the stratigraphic succession (Figure 9). Given the uncertainty of this time–thickness function resulting from the low-resolution time constraints, several scenarios of Ã′ curves can be obtained from a unique real A curve. It is even possible to generate Ã′ curves with opposite polarity in some stratigraphic intervals (Figure 9). The estimation of accommodation rates and sedimentation rates, known as fundamental sequence stratigraphic parameters for interpreting system tracts, relies on a hypothetical and uncertain time–thickness function. Opposite vertical trends of the accommodation rate can be calculated in several intervals.
This means that even if carbonate production rates are considered to remain constant throughout the succession, A′/S′ trends are still highly uncertain given the uncertainties associated with the paleobathymetry and the time–thickness function. It is clear from this example that the interpretation of apparent and real accommodation from one single vertical succession requires a multiscenario approach.
The same method using apparent accommodation calculations (equation 4) has been applied to a nearby, laterally continuous, Urgonian carbonate outcrop, illustrating the transition from inner platform to outer shelf (Figure 1). The objective is to check how apparent Ã′ curves can be correlated between distant locations (Figure 10). The apparent Ã′ is computed according to the sedimentary profile in Figure 9. It is assumed that there is no uncertainty in the paleobathymetry reconstructions because exposure surfaces and beach environments are robust markers of water depth and base level. Real stratigraphic correlations have been directly mapped on the outcrop and compared to the calculated apparent Ã′ curves (Figure 10). The overall increasing accommodation trend and sharp changes in accommodation (positive or negative) are well correlated throughout the inner-platform to outer-shelf transect. At the base of the succession, dominated by deeper and more distal facies, there is a clear, continuous decrease of apparent accommodation. A similar decreasing trend is recognized at the top of the succession between the outer platform and the outer shelf. It is possible to interpret that one exposure surface in the inner platform is correlated to negative apparent accommodation in the outer-platform and outer-shelf domains. Correlating the small accommodation changes from the inner-platform units to those of the outer shelf is, however, not straightforward. The same conclusion was made from similar analyses of the synthetic stratigraphic model (Figures 7, 8). The calculated apparent accommodation from the shallower, inner-platform domain, punctuated by frequent exposures and stratigraphic hiatuses, does not match the real accommodation systematically. It is not simply correlated to the apparent accommodation calculated for the outer platform and the outer shelf. Assessment of Ã′/ trends depends, as previously, on the time–thickness function, mostly affected by the stratigraphic hiatus occurring in the inner-platform domain, and on the paleobathymetry uncertainties.
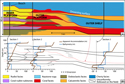 Figure 10. Stratigraphic correlation of apparent accommodation, calculated in three pseudowells, in a laterally continuous carbonate outcrop, Lower Cretaceous platform in Provence (La Nesque Canyon, southeastern France; location in Figure 2). (A) High-resolution stratigraphic section. (B) Correlation of bathymetry and apparent accommodation trends in different locations. Facies and environments of deposition correspond to the sedimentary profile in Figure 9. The real accommodation change (sea level and subsidence) is considered equal along the studied transect (6 km). Bathymetry uncertainty is minimized by several occurrences of unambiguous water–depth datum (exposure surfaces and beach rocks) and the lateral continuity of the strata. Thicker time lines correspond to the actual stratigraphic correlation of the apparent accommodation between the pseudowells. An overall increasing trend and several accommodation cycles are correlated between the three sections. The correlation is best in outer-platform and outer-shelf environments like in the stratigraphic forward model (Figures 6–8). It is possible to interpret that the one exposure surface in the inner platform is correlated to negative apparent accommodation in the outer-platform and outer-shelf domains.
This method allows the apparent accommodation curve along the depth axis to be drawn in all locations of a CSS and possible stratigraphic correlations to be made. In addition to the interpretation of critical stratigraphic surfaces, including exposure or drowning surfaces and stratigraphic unconformity, and to the interpretation of chronostratigraphic markers, fossils, or chemicals, the method can help to build a high-resolution stratigraphic framework. It offers the opportunity for assessing the uncertainty related to the interpretation of the deposition environment (i.e., bathymetry) and the time–thickness function and for establishing several scenarios of real accommodation curve (sea level and subsidence).These scenarios can be, in turn, tested in 2-D or 3-D using stratigraphic forward modeling tools (Figure 4; Cross and Lessenger, 1999; Burgess, 2006; Burgess and Prince, 2015). We thus recommend applying stratigraphic forward modeling to validate sequence stratigraphic interpretations of CSSs following the principles illustrated in Figure 11. Since it is not realistic to directly measure sea level, subsidence and sedimentation fluxes from outcrops, or subsurface data, testing different sea-level and subsidence scenarios and estimating uncertainties are required. Apparent accommodation curves can be built from the modeled stratigraphic grid and compared to the apparent accommodation curves obtained from the real data (Figure 11). It is important to keep in mind that this iterative and quantitative sequence stratigraphy method relies strongly on hypothetical carbonate production rates based on available data and a priori knowledge (e.g., Montaggioni et al., 2015). Despite approximation of the sediment transport model in the software and the significant uncertainties in the input parameters (initial topography, accommodation, carbonate production and transport, hydrodynamics), this approach can still provide self-coherent stratigraphic models that are consistent with available field data (outcrops, seismic, wells) (Lanteaume et al., 2018). The two apparent accommodation curves derived from real CSS (outcrops, subsurface) and synthetic stratigraphic models, respectively, can be compared (Figure 11). Establishing the discrepancies between modeled and actual parameters can be considered to be an objective function allowing quantitative comparisons between real CSS and modeled CSS, in other words, between predictions and observations. Such comparisons cannot be made from classical carbonate sequence stratigraphic models (Table 1). These lack quantification of critical sequence stratigraphic parameters (A, S, A′, S′) and sensitivity analyses of critical environmental parameters (i.e., carbonate production, paleobathymetry, time–thickness function). Comparing the real and modeled parameters (e.g., apparent accommodation) can help to validate the sequence stratigraphic interpretations and subsequent stratigraphic correlations. Such a validation is currently missing in classical industrial workflow (Borgomano et al., 2008), although it is very relevant for carbonate reservoir modeling (Lanteaume et al., 2018).
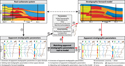 Figure 11. Protocol of quantitative sequence stratigraphy. The philosophy of this new method is to compare and match, through an iterative approach, apparent sequence stratigraphic parameters (ASSP) calculated from real and modeled carbonate sedimentary system (CSS). Actual accommodation (sea level and subsidence in 3-D) can be interpreted from ASSP extracted from the real CSS, considering all the uncertainties (compaction, bathymetry, time–thickness function). Several scenarios of carbonate production and transport, initial topography, and accommodation can be tested with the stratigraphic forward model. The ASSP calculated from the modeled stratigraphic grids and the real CSS can be compared. Sensitivity analysis of critical parameters impacting the sequence stratigraphic correlations of the real CSS can be performed.
CONCLUSION
Stratigraphic forward modeling helps to demonstrate that a unique and simple sequence stratigraphic signal in time and space (A′/S′) is not preserved in platform, ramplike CSS, even if carbonate production remains constant in time and the accommodation curve is uniform in space. Depending on accommodation and carbonate production, opposite sequence stratigraphic trends (i.e., progradation and retrogradation) can be time equivalent in a single CSS. Apparent and preserved Ã′/ sequence stratigraphic parameters are distinguished from the actual A′/S′ parameters that control the stratigraphic response of the CSS. Apparent Ã′/
 trends are not systematically intercorrelated between proximal and distal platform locations and do not typify specific stratigraphic architectures. This is the direct consequence of the spatial and synchronous variations of carbonate production rates along the platform profile.
Without evidence from seismic images or continuous outcrops, or high-resolution dating methods, the construction of 3-D stratigraphic architecture of carbonate platforms, including reservoir models, cannot be based only on standard, qualitative, sequence stratigraphic correlations, based on subjective estimation of apparent Ã′/ , from wells in distant locations. This is particularly true in aggrading and prograding CSS, characterized by significant lateral changes in layer thickness, bathymetry, and apparent carbonate production rates. Actual accommodation (the sum of sea level and subsidence) can, however, be inversed from the stratigraphic records, given an estimate of bathymetry and thickness parameters for each time increment in the different locations. The effect of compaction also needs to be assessed in this approach, especially where variations in sediment grain size and early diagenetic transformations may result in significant mechanical heterogeneities (e.g., Goldhammer, 1997).
In real CSS, sharp changes in apparent accommodation can exceed paleobathymetry uncertainty. This implies that several scenarios of accommodation can coexist, not allowing a simple inversion of accommodation and sea-level curves from one single location. Uncertainty in the time–thickness function also prevents the establishment of a unique trend of accommodation and sedimentation rate ratios (i.e., stacking patterns) from one single outcrop section or subsurface well. Despite these uncertainties, and given estimates on paleobathymetry, it is possible to establish stratigraphic correlations based on apparent accommodation curves from distant locations. General apparent accommodation trends are correlated across the platform profile from the inner-platform to outer-shelf domains, whereas the sharp changes in accommodation (negative and positive excursions) are best correlated between the outer-platform to outer-shelf domains, where subaerial exposures are scarce and stratigraphic hiatuses are minor. Inversely, these sharp changes are more difficult to correlate from the inner to the outer-platform areas.
The inversion of accommodation curves from 3-D real carbonate stratigraphic records is dependent on the time–depth function and on the local preservation of thickness and bathymetry parameters for each time layer. Given estimates on carbonate production, depositional profile, paleobathymetry, initial topography, and time–thickness function, these accommodation curves have to be tested with stratigraphic forward modeling tools. Matching the apparent accommodation obtained from real CSS and stratigraphic models is needed as an objective function, allowing for a formal comparison between stratigraphic predictions and stratigraphic observations. It is anticipated that this numerical formalism can open scientific debate on sequence stratigraphic principles, especially on the meaning of theoretical A′/S′ ratio in CSS when time and stratigraphic hiatus are not properly constrained. Limitations of the presented approach are mainly related to uncertainties of absolute time measurements and sedimentary process simplifications inherent to stratigraphic forward modeling tools.
REFERENCES CITED
Aconcha, E. S., C. Kerans, and H. Zeng, 2008, Seismic geomorphology applied to Lower Glen Rose Patch Reefs in the Maverick Basin, Southwest Texas: Gulf Coast Association of Geological Societies 58th Annual Convention, Houston, Texas, October 6–7, 2008, p. 3–24.
Adams, E. W., C. Grélaud, M. Pal, A. É. Csoma, O. S. Al Ja’aidi, and R. Al Hinai, 2011, Improving reservoir models of Cretaceous carbonates with digital outcrop modelling (Jabal Madmar, Oman): Static modelling and simulating clinoforms: Petroleum Geoscience, v. 17, no. 3, p. 309–332, doi:10.1144/1354-079310-031.
Ainsworth, R. B., J. B. McArthur, S. C. Lang, and A. J. Vonk, 2018, Quantitative sequence stratigraphy: AAPG Bulletin, v. 102, no. 10, p. 1913–1939, doi:10.1306/02201817271.
Al-Qayim, B., 2010, Sequence stratigraphy and reservoir characteristics of the Turonian-Coniacian Khasib Formation in central Iraq: Journal of Petroleum Geology, v. 33, no. 4, p. 387–403, doi:10.1111/j.1747-5457.2010.00486.x.
Amodio, S., V., Ferreri, and B. D’Argenio, 2013, Cyclostratigraphic and chronostratigraphic correlations in the Barremian–Aptian shallow-marine carbonates of the central-southern Apennines (Italy): Cretaceous Research, v. 44, p. 132–156, doi:10.1016/j.cretres.2013.04.003.
Anan, T. I., 2014, Facies analysis and sequence stratigraphy of the Cenomanian–Turonian mixed siliciclastic–carbonate sediments in west Sinai, Egypt: Sedimentary Geology, v. 307, p. 34–46, doi:10.1016/j.sedgeo.2014.04.006.
Barnett, A. J., P. M. Burgess, and V. P. Wright, 2002, Icehouse world sea-level behaviour and resulting stratal patterns in late Visean (Mississippian) carbonate platforms: Integration of numerical forward modelling and outcrop studies: Basin Research, v. 14, no. 3, p. 417–438, doi:10.1046/j.1365-2117.2002.00186.x.
Belopolsky, A. V., and A. W. Droxler, 2004, Seismic expressions of prograding carbonate bank margins: Middle Miocene, Maldives, Indian Ocean, in G. P. Eberli, J. L. Masaferro, and J. F. Sarg, eds., Seismic imaging of carbonate reservoirs and systems: AAPG Memoir 81, p. 267–290.
Bonin, A., E. Vennin, E. Pucéat, M. Guiraud, A. Arnaud-Vanneau, T. Adatte, B. Pittet, and E. Mattioli, 2012, Community replacement of neritic carbonate organisms during the late Valanginian platform demise: A new record from the Provence Platform: Palaeogeography, Palaeoclimatology, Palaeoecology, v. 365–366, p. 57–80, doi:10.1016/j.palaeo.2012.09.014.
Booler, J., and M. E. Tucker, 2002, Distribution and geometry of facies and early diagenesis: The key to accommodation space variation and sequence stratigraphy: Upper Cretaceous Congost Carbonate platform, Spanish Pyrenees: Sedimentary Geology, v. 146, nos. 3–4, p. 225–247, doi:10.1016/S0037-0738(01)00120-8.
Borgomano, J. R. F., 2000, The Upper Cretaceous carbonates of the Gargano–Murge region, southern Italy: A model of platform-to-basin transition: AAPG Bulletin, v. 84, no. 10, p. 1561–1588, doi:10.1306/8626bf01-173b-11d7-8645000102c1865d.
Borgomano, J. R. F., F. Fournier, S. Viseur, and L. Rijkels, 2008, Stratigraphic well correlations for 3-D static modeling of carbonate reservoirs: AAPG Bulletin, v. 92, no. 6, p. 789–824, doi:10.1306/02210807078.
Borgomano, J. R. F., and J. M. Peters, 2004, Outcrop and seismic expressions of coral reefs, carbonate platforms, and adjacent deposits in the tertiary of the Salalah Basin, South Oman, in G. P. Eberli, J. L. Masaferro, and J. F. Sarg, eds., Seismic imaging of carbonate reservoirs and systems: AAPG Memoir 81, p. 251–266.
Bosscher, H., and W. Schlager, 1992, Computer simulation of reef growth: Sedimentology, v. 39, no. 3, p. 503–512, doi:10.1111/j.1365-3091.1992.tb02130.x.
Bover-Arnal, T., R. Salas, J. Guimerà, and J. A. Moreno-Bedmar, 2014, Deep incision in an Aptian carbonate succession indicates major sea-level fall in the Cretaceous: Sedimentology, v. 61, no. 6, p. 1558–1593, doi:10.1111/sed.12105.
Bover-Arnal, T., R. Salas, J. A. Moreno-Bedmar, and K. Bitzer, 2009, Sequence stratigraphy and architecture of a late Early–Middle Aptian carbonate platform succession from the western Maestrat Basin (Iberian Chain, Spain): Sedimentary Geology, v. 219, nos. 1–4, p. 280–301, doi:10.1016/j.sedgeo.2009.05.016.
Brynjarsdóttir, J., and A. O’Hagan, 2014, Learning about physical parameters: The importance of model discrepancy: Inverse Problems, v. 30, no. 11, 24 p., doi:10.1088/0266-5611/30/11/114007.
Burgess, P. M., 2001, Modeling carbonate sequence development without relative sea-level oscillations: Geology, v. 29, no. 12, p. 1127–1130, doi:10.1130/0091-7613(2001)029<1127:MCSDWR>2.0.CO;2.
Burgess, P. M., 2006, The signal and the noise: Forward modeling of allocyclic and autocyclic processes influencing peritidal carbonate stacking patterns: Journal of Sedimentary Research, v. 76, no. 7, p. 962–977, doi:10.2110/jsr.2006.084.
Burgess, P. M., 2016, The future of the sequence stratigraphy paradigm: Dealing with a variable third dimension: Geology, v. 44, no. 4, p. 335–336, doi:10.1130/focus042016.1.
Burgess, P. M., and G. D. Prince, 2015, Non-unique stratal geometries: Implications for sequence stratigraphic interpretations: Basin Research, v. 27, no. 3, p. 351–365, doi:10.1111/bre.12082.
Burgess, P. M., and V. P. Wright, 2003, Numerical forward modeling of carbonate platform dynamics: An evaluation of complexity and completeness in carbonate strata: Journal of Sedimentary Research, v. 73, no. 5, p. 637–652, doi:10.1306/020503730637.
Burgess, P. M., V. P. Wright, and D. Emery, 2001, Numerical forward modelling of peritidal carbonate parasequence development: Implications for outcrop interpretation: Basin Research, v. 13, no. 1, p. 1–16, doi:10.1046/j.1365-2117.2001.00130.x.
Catuneanu, O., 2006, Principles of sequence stratigraphy: Amsterdam, Elsevier, 375 p.
Catuneanu, O., 2017, Sequence stratigraphy: Guidelines for a standard methodology: Stratigraphy & Timescales, v. 2, p. 1–57, doi:10.1016/bs.sats.2017.07.003.
Catuneanu, O., V., Abreu, J. P. Bhattacharya, M. D. Blum, R. W. Dalrymple, P. G. Eriksson, and C. R. Fielding, et al., 2009, Towards the standardization of sequence stratigraphy: Earth-Science Reviews, v. 92, nos. 1–2, p. 1–33, doi:10.1016/j.earscirev.2008.10.003.
Catuneanu, O., W. E. Galloway, C. G. S. C. Kendall, A. D. Miall, H. W. Posamentier, A. Strasser, and M. E. Tucker, 2011, Sequence stratigraphy: Methodology and nomenclature: Newsletters on Stratigraphy, v. 44, no. 3, p. 173–245, doi:10.1127/0078-0421/2011/0011.
Clavel, B., M. A. Conrad, R. Busnardo, J. Charollais, and B. Granier, 2013, Mapping the rise and demise of Urgonian platforms (Late Hauterivian - Early Aptian) in southeastern France and the Swiss Jura: Cretaceous Research, v. 39, p. 29–46, doi:10.1016/j.cretres.2012.02.009.
Cross, T. A., and M. A. Lessenger, 1999, Construction and application of a stratigraphic inverse model, in J. W. Harbaugh, W. L. Watney, E. C. Rankey, R. Slingerland, R. H. Goldstein, and E. K. Franseen, eds., Numerical experiments in stratigraphy: Recent advances in stratigraphic and sedimentologic computer simulations: Tulsa, Oklahoma, SEPM Special Publication 62, p. 69–83.
Droste, H., 2010, High-resolution seismic stratigraphy of the Shu’aiba and Natih formations in the Sultanate of Oman: Implications for Cretaceous epeiric carbonate platform systems, inF. S. P. van Buchem, K. D. Gerdes, and M. Esteban, eds., Mesozoic and Cenozoic carbonate systems of the Mediterranean and the Middle East: Stratigraphic and diagenetic reference models: Geological Society, London, Special Publications 2010, v. 329, p. 145–162, doi:10.1144/SP329.7.
Droste, H., and M. Van Steenwinkel, 2004, Stratal geometries and patterns of platform Carbonates: The Cretaceous of Oman, in G. P. Eberli, J. L. Masaferro, and J. F. Sarg, eds., Seismic imaging of carbonate reservoirs and systems: AAPG Memoir 81, p. 185–206.
Eberli, G. P., 2013, The uncertainties involved in extracting amplitude and frequency of orbitally driven sea-level fluctuations from shallow-water carbonate cycles: Sedimentology, v. 60, no. 1, p. 64–84, doi:10.1111/sed.12011.
Eberli, G. P., C. Betzler, and F. Anselmetti, 2004, Carbonate platform to basin transitions on seismic data and in outcrops: Great Bahama Bank and the Maiella Platform Margin, Italy, in G. P. Eberli, J. L. Masaferro, and J. F. Sarg, eds., Seismic imaging of carbonate reservoirs and systems: AAPG Memoir 81, p. 207–250.
Embry, J.-C., E. Vennin, F. S. P. Van Buchem, R. Schroeder, C. Pierre, and M. Aurell, 2010, Sequence stratigraphy and carbon isotope stratigraphy of an Aptian mixed carbonate-siliciclastic platform to basin transition (Galve sub-basin, NE Spain), in F. S. P. van Buchem, K. D. Gerdes, and M. Esteban, eds., Mesozoic and Cenozoic carbonate systems of the Mediterranean and the Middle East: Stratigraphic and diagenetic reference models: Geological Society, London, Special Publications 2010, v. 329, p. 113–143, doi:10.1144/SP329.6.
Enos, P., 1991, Sedimentary parameters for computer modeling: Kansas Geological Survey Bulletin, v. 233, p. 63–99.
Farouk, S., 2015, Upper Cretaceous sequence stratigraphy of the Galala Plateaux, western side of the Gulf of Suez, Egypt: Marine and Petroleum Geology, v. 60, p. 136–158, doi:10.1016/j.marpetgeo.2014.11.005.
Föllmi, K. B., and A. Godet, 2013, Palaeoceanography of Lower Cretaceous Alpine platform carbonates: Sedimentology, v. 60, no. 1, p. 131–151, doi:10.1111/sed.12004.
Godet, A., C. Durlet, J. E. Spangenberg, and K. B. Föllmi, 2016, Estimating the impact of early diagenesis on isotope records in shallow-marine carbonates: A case study from the Urgonian Platform in western Swiss Jura: Palaeogeography, Palaeoclimatology, Palaeoecology, v. 454, p. 125–138, doi:10.1016/j.palaeo.2016.04.029.
Goldhammer, R. K., 1997, Compaction and decompaction algorithms for sedimentary carbonates: Journal of Sedimentary Research, v. 67, no. 1, p. 26–35.
Granjeon, D., 1997, Modélisation stratigraphique déterministe: Conception et applications d’un modèle diffusif 3D multilithologique, Ph.D. thesis, Université de Rennes I, Rennes, France, 216 p.
Granjeon, D., and P. Joseph, 1999, Concepts and applications of a 3-D multiple lithology diffusive model in stratigraphic modeling, in J. W. Harbaugh, W. L. Watney, E. C. Rankey, R. Slingerland, R. H. Goldstein, and E. K. Franseen, eds., Numerical experiments in stratigraphy: Recent advances in stratigraphic and sedimentologic computer simulations: Tulsa, Oklahoma, SEPM Special Publication 62, p. 197–210.
Grélaud, C., P. Razin, and P. Homewood, 2010, Channelized systems in an inner carbonate platform setting: Differentiation between incisions and tidal channels (Natih Formation, Late Cretaceous, Oman), in F. S. P. van Buchem, K. D. Gerdes, and M. Esteban, eds., Mesozoic and Cenozoic carbonate systems of the Mediterranean and the Middle East: Stratigraphic and diagenetic reference models: Geological Society, London, Special Publications 2010, v. 329, p. 163–186, doi:10.1144/SP329.8.
Handford, C. R., and R. G. Loucks, 1993, Carbonate depositional sequences and systems tracts—Responses of carbonate platforms to relative sea-level changes: in R. G. Loucks and J. F. Sarg, eds., Carbonate sequence stratigraphy: Recent developments and applications: AAPG Memoir 57, p. 3–41.
Hfaiedh, R., A. Arnaud Vanneau, A. Godet, H. Arnaud, I. Zghal, J. Ouali, J.-L. Latil, and H. Jallali, 2013, Biostratigraphy, palaeoenvironments and sequence stratigraphy of the Aptian sedimentary succession at Jebel Bir Oum Ali (Northern Chain of Chotts, South Tunisia): Comparison with contemporaneous Tethyan series: Cretaceous Research, v. 46, p. 177–207, doi:10.1016/j.cretres.2013.08.004.
Hill, J., R. Wood, A. Curtis, and D. M. Tetzlaff, 2012, Preservation of forcing signals in shallow water carbonate sediments: Sedimentary Geology, v. 275–276, p. 79–92, doi:10.1016/j.sedgeo.2012.07.017.
Homewood, P., P. Razin, C. Grélaud, H. Droste, V. Vahrenkamp, M. Mettraux, and J. Mattner, 2008, Outcrop sedimentology of the Natih Formation, northern Oman: A field guide to selected outcrops in the Adam Foothills and Al Jabal al Akhdar areas: GeoArabia, v. 13, no. 3, p. 39–87.
Homewood, P. W., P. Maurland, F. Lafont, and P. Sorriaux, Elf Exploration Production Predictive Stratigraphy Network, 2000, Best practices in sequence stratigraphy: For explorationists and reservoir engineers: Pau, France, Elf Exploration Production Memoir 25, 81 p.
Jacquin, T., G. Rusciadelli, F. Amedro, P.-C. de Graciansky, and F. Magniez-Jannin, 1998, The North Atlantic cycle: An overview of 2nd-order transgressive/regressive facies cycles in the Lower Cretaceous of Western Europe, in P.-C. de Graciansky, J. Hardenbol, T. Jacquin, and P. R. Vail, eds., Mesozoic and Cenozoic sequence stratigraphy of European basins: Tulsa, Oklahoma, SEPM Special Publication 60, p. 397–409.
Janson, X., C. Kerans, R. Loucks, M. A. Marhx, C. Reyes, and F. Murguia, 2011, Seismic architecture of a Lower Cretaceous platform-to-slope system, Santa Agueda and Poza Rica fields, Mexico: AAPG Bulletin, v. 95, no. 1, p. 105–146.
Kenter, J. A. M., F. Van Hoeflaken, J. R. Bahamonde, G. L. B. Gartner, L. Keim, and R. E. Besems, 2002, Anatomy and lithofacies of an intact and seismic-scale carboniferous carbonate platform (Asturias, NW Spain): Analogues of hydrocarbon reservoirs in the Pricaspian Basin (Kazakhstan), in W. G. Zempolich and H. E. Cook, eds., Commonwealth of Independent States (CIS): Subsurface reservoirs and outcrop analogs: Tulsa, Oklahoma, SEPM Special Publication 74, p. 181–203.
Khalifa, M. A., M. S. Abu El-Ghar, S. A. Helal, and A. W. Hussein, 2014, Sequence stratigraphy of the Cenomanian Galala Formation, north Eastern desert, Egypt: Journal of African Earth Sciences, v. 89, p. 133–148, doi:10.1016/j.jafrearsci.2013.09.005.
Lallier, F., G. Caumon, J. Borgomano, S. Viseur, J.-J. Royer, and C. Antoine, 2016, Uncertainty assessment in the stratigraphic well correlation of a carbonate ramp: Method and application to the Beausset Basin, SE France: Comptes Rendus Geoscience, v. 348, no. 7, p. 499–509, doi:10.1016/j.crte.2015.10.002.
Lanteaume, C., F. Fournier, M. Pellerin, and J. Borgomano, 2018, Testing geological assumptions and scenarios in carbonate exploration: Insights from integrated stratigraphic, diagenetic and seismic forward modeling: Leading Edge, v. 37, no. 9, p. 672–680, doi:10.1190/tle37090672.1.
Léonide, P., J. Borgomano, J.-P. Masse, and S. Doublet, 2012, Relation between stratigraphic architecture and multi-scale heterogeneities in carbonate platforms: The Barremian-lower Aptian of the Monts de Vaucluse, SE France: Sedimentary Geology, v. 265–266, p. 87–109, doi:10.1016/j.sedgeo.2012.03.019.
Loucks, R. G., and C. Kerans, 2003, Lower Cretaceous Glen Rose “patch reef” reservoir in the Chittim Field, Maverick County, South Texas: Gulf Coast Association of Geological Societies Transactions, v. 53, p. 490–503.
Masse, J., and L. F. Montaggioni, 2001, Growth history of shallow-water carbonates: Control of accommodation on ecological and depositional processes: International Journal of Earth Sciences, v. 90, no. 2, p. 452–469, doi:10.1007/s005310000143.
Masse, J.-P., and M. Fenerci Masse, 2011, Drowning discontinuities and stratigraphic correlation in platform carbonates. The late Barremian-early Aptian record of southeast France: Cretaceous Research, v. 32, no. 6, p. 659–684, doi:10.1016/j.cretres.2011.04.003.
Maurer, F., K. Al-Mehson, B. J. Pierson, G. P. Eberli, G. Warrlich, D. Drysdale, and H. J. Droste, 2010, Facies characteristics and architecture of Upper Aptian Shu’aiba clinoforms in Abu Dhabi, in F. S. P. van Buchem, M. I. Al-Husseini, F. Maurer, and H. J. Droste, eds., Barremian - Aptian stratigraphy and hydrocarbon habitat of the eastern Arabian Plate: Manama, Bahrain, GeoArabia Special Publication 4, p. 445–468.
Maurer, F., F. S. P. van Buchem, G. P. Eberli, B. J. Pierson, M. J. Raven, P.-H. Larsen, M. I. Al-Husseini, and B. Vincent, 2013, Late Aptian long-lived glacio-eustatic lowstand recorded on the Arabian Plate: Terra Nova, v. 25, no. 2, p. 87–94, doi:10.1111/ter.12009.
Miall, A. D., 2016, Stratigraphy: A modern synthesis: Berlin, Springer, 454 p., 10.1007/978-3-319-24304-7.
Miall, A. D., and C. E. Miall, 2001, Sequence stratigraphy as a scientific enterprise: The evolution and persistence of conflicting paradigms: Earth-Science Reviews, v. 54, no. 4, p. 321–348, doi:10.1016/S0012-8252(00)00041-6.
Montaggioni, L. F., J. Borgomano, F. Fournier, and D. Granjeon, 2015, Quaternary atoll development: New insights from the two-dimensional stratigraphic forward modelling of Mururoa Island (Central Pacific Ocean): Sedimentology, v. 62, no. 2, p. 466–500, doi:10.1111/sed.12175.
Moore, C. H., and W. J. Wade, 2013, Carbonate reservoirs: Porosity and diagenesis in a sequence stratigraphic framework: Amsterdam, Elsevier, 374 p.
Neal, J., and V. Abreu, 2009, Sequence stratigraphy hierarchy and the accommodation succession method: Geology, v. 37, no. 9, p. 779–782, doi:10.1130/G25722A.1.
Phelps, R. M., C. Kerans, R. G. Loucks, R. O. B. P. Da Gama, J. Jeremiah, and D. Hull, 2014, Oceanographic and eustatic control of carbonate platform evolution and sequence stratigraphy on the Cretaceous (Valanginian–Campanian) passive margin, northern Gulf of Mexico: Sedimentology, v. 61, no. 2, p. 461–496, doi:10.1111/sed.12062.
Phelps, R. M., C. Kerans, S. Z. Scott, X. Janson, and J. A. Bellian, 2008, Three-dimensional modelling and sequence stratigraphy of a carbonate ramp-to-shelf transition, Permian Upper San Andres Formation: Sedimentology, v. 55, no. 6, p. 1777–1813, doi:10.1111/j.1365-3091.2008.00967.x.
Pierson, B. J., G. P. Eberli, K. Al-mehsin, S. Al-menhali, H. J. Droste, F. Maurer, J. Whitworth, and D. Drysdale, 2010, Seismic stratigraphy and depositional history of the Upper Shu’aiba (Late Aptian) in the UAE and Oman, in F.S.P. van Buchem, M. I. Al-Husseini, F. Maurer, and H. J. Droste, eds., Barremian–Aptian stratigraphy and hydrocarbon habitat of the Eastern Arabian Plate: Manama, Bahrain, GeoArabia Special Publication 4, p. 411–444.
Pomar, L., and B. U. Haq, 2016, Decoding depositional sequences in carbonate systems: Concepts vs experience: Global and Planetary Change, v. 146, p. 190–225, doi:10.1016/j.gloplacha.2016.10.001.
Pomar, L., M. Morsilli, P. Hallock, and B. Bádenas, 2012, Internal waves, an under-explored source of turbulence events in the sedimentary record: Earth-Science Reviews, v. 111, nos. 1–2, p. 56–81, doi:10.1016/j.earscirev.2011.12.005.
Pomar, L., and W. C. Ward, 1995, Sea-level changes, carbonate production and platform architecture: The Llucmajor Platform, Mallorca, Spain, in Haq, B. U., ed., Sequence stratigraphy and depositional response to eustatic, tectonic and climatic forcing: Dordrecht, the Netherlands, Springer, p. 87–112, doi:10.1007/978-94-015-8583-5_4.
Posamentier, H. W., and G. P. Allen, 1999, Siliciclastic sequence stratigraphy–Concepts and applications: Tulsa, Oklahoma, SEPM Concepts in Sedimentology and Paleontology 7, 212 p.
Purkis, S. J., and P. M. Harris, 2017, Quantitative interrogation of a fossilized carbonate sand body - The Pleistocene Miami oolite of South Florida: Sedimentology, v. 64, no. 5, p. 1439–1464, doi:10.1111/sed.12367.
Qayyum, F., O. Catuneanu, and P. de Groot, 2015, Historical developments in Wheeler diagrams and future directions: Basin Research, v. 27, no. 3, p. 336–350, doi:10.1111/bre.12077.
Razin, P., F. Taati, and F. S. P. van Buchem, 2010, Sequence stratigraphy of Cenomanian–Turonian carbonate platform margins (Sarvak Formation) in the High Zagros, SW Iran: An outcrop reference model for the Arabian Plate, in F. S. P van Buchem, K. D. Gerdes, and M. Esteban, eds., Mesozoic and Cenozoic carbonate systems of the Mediterranean and the Middle East: Stratigraphic and diagenetic reference models: Geological Society, London, Special Publications 2010, v. 329, p. 187–218, doi:10.1144/SP329.9.
Read, J. F., 1998, Reviewed work: Sequence stratigraphy and characterization of carbonate reservoirs: PALAIOS, v. 13, no. 3, p. 307, doi:10.2307/3515455.
Reijmer, J. J. G., P. K. Swart, T. Bauch, R. Otto, L. Reuning, S. Roth, and S. Zechel, 2009, A re-evaluation of facies on Great Bahama Bank I: New facies maps of western Great Bahama Bank: International Association Special Publications 41, p. 29–46, doi:10.1002/9781444312065.ch3.
Richet, R., J. Borgomano, E. W. Adams, J. P. Masse, and S. Viseur, 2011, Numerical outcrop geology applied to stratigraphical modeling of ancient carbonate platforms: The Lower Cretaceous Vercors carbonate platform (SE France), in O. J. Martinsen, A. J. Pulham, P. D. W. Haughton, and M. D. Sullivan, eds., Outcrops revitalized: Tools, techniques and applications: Tulsa, Oklahoma, SEPM Concepts in Sedimentology and Paleontology 10, p. 195–209.
Sadler, P. M., 1994, The expected duration of upward-shallowing peritidal carbonate cycles and their terminal hiatuses: Geological Society of America Bulletin, v. 106, no. 6, p. 791–802, doi:10.1130/0016-7606(1994)106<0791:TEDOUS>2.3.CO;2.
Sarg, J. F., 1988, Carbonate sequence stratigraphy, in C. K. Wilgus, B. S. Hastings, H. Posamentier, J. Van Wagoner, C. A. Ross, and C. G. St. C. Kendall, eds., Sea-level changes: An integrated approach: Tulsa, Oklahoma, SEPM Special Publication 42, p. 155–181, doi:10.2110/pec.88.01.0155.
Sattler, U., A. Immenhauser, H. Hillgärtner, and M. Esteban, 2005, Characterization, lateral variability and lateral extent of discontinuity surfaces on a Carbonate Platform (Barremian to Lower Aptian, Oman): Sedimentology, v. 52, no. 2, p. 339–361, doi:10.1111/j.1365-3091.2005.00701.x.
Schlager, W., 1981, The paradox of drowned reefs and carbonate platforms: Geological Society of America Bulletin, v. 92, no. 4, p. 197–201, doi:10.1130/0016-7606(1981)92<197:TPODRA>2.0.CO;2.
Schlager, W., 1993, Accommodation and supply a dual control on stratigraphic sequences: Sedimentary Geology, v. 86, nos. 1–2, p. 111–136, doi:10.1016/0037-0738(93)90136-S.
Schlager, W., 2005, Carbonate sedimentology and sequence stratigraphy: Tulsa, Oklahoma, SEPM Concepts in Sedimentology and Paleontology 8, 200 p., doi:10.2110/csp.05.08.
Schlager, W., 2010, Ordered hierarchy versus scale invariance in sequence stratigraphy: International Journal of Earth Sciences, v. 99, p. 139–151, doi:10.1007/s00531-009-0491-8.
Schroeder, R., F. S. P. van Buchem, A. Cherchi, D. Baghbani, B. Vincent, A. Immenhauser, and B. Granier, 2010, Revised orbitolinid biostratigraphic zonation for the Barremian–Aptian of the eastern Arabian Plate and implications for regional stratigraphic correlations, in F.S.P. van Buchem, M. I. Al-Husseini, F. Maurer, and H. J. Droste, eds., Barremian–Aptian stratigraphy and hydrocarbon habitat of the eastern Arabian Plate: Manama, Bahrain, GeoArabia Special Publication 4, v. 1, p. 49–96.
Sharland, P. R., R. Archer, D. M. Casey, R. B. Davies, S. H. Hall, A. P. Heward, A. D. Horbury, and M. D. Simmons, 2001, Arabian Plate sequence stratigraphy: Manama, Bahrain, GeoArabia Special Publication 2, 371 p.
Sharp, I., P. Gillespie, D. Morsalnezhad, C. Taberner, R. Karpuz, J. Vergés, A. Horbury, N. Pickard, J. Garland, and D. Hunt, 2010, Stratigraphic architecture and fracture-controlled dolomitization of the Cretaceous Khami and Bangestan groups: An outcrop case study, Zagros Mountains, Iran, in F. S. P. van Buchem, K. D. Gerdes, and M. Esteban, eds., Mesozoic and Cenozoic carbonate systems of the Mediterranean and the Middle East: Stratigraphic and diagenetic reference models: Geological Society, London, Special Publications 2010, v. 329, p. 343–396, doi:10.1144/SP329.14.
Simmons, M., D. Casey, R. Davies, S. Holmes, F. Schulze, P. Sharland, and O. S. Neftex, 2006, Arabian plate sequence stratigraphy: Potential consequences for global chronostratigraphy: GEO 2006 Middle East Conference and Exhibition, Manama, Bahrain, March 27–29, 2006, p. 101–130.
Smith, L. B., G. P. Eberli, J. L. Masaferro, and S. Al-Dhahab, 2003, Discrimination of effective from ineffective porosity in heterogeneous Cretaceous carbonates, Al Ghubar field, Oman: AAPG Bulletin, v. 87, no. 9, p. 1509–1529, doi:10.1306/041703200180.
Sonnenfeld, M. D., and T. A. Cross, 1993, Volumetric partitioning and facies differentiation within the Permian Upper San Andres Formation of Last Chance Canyon, Guadalupe Mountains, New Mexico, in R. G. Loucks and J. F. Sarg, eds., Carbonate sequence stratigraphy: Recent developments and applications: AAPG Memoir 57, p. 435–474.
Strohmenger, C. J., A. Ghani, O. Al-Jeelani, A. Al-Mansoori, T. Al-Dayyani, L. J. Weber, K. Al-Mehsin, L. Vaughan, S. A. Khan, and J. C. Mitchell, 2006, High-resolution sequence stratigraphy and reservoir characterization of Upper Thamama (Lower Cretaceous) reservoirs of a giant Abu Dhabi oil field, United Arab Emirates, in P. M. Harris and L. J. Weber, eds., Giant hydrocarbon reservoirs of the world: From rocks to reservoir characterization and modeling: AAPG Memoir 88, p. 139–171.
Tendil, A. J., C. Frau, L. Philippe, F. Fournier, J. R. Borgomano, C. Lanteaume, J. Masse, G. Massonnat, and J. Rolando, 2018, Platform-to-basin anatomy of a Barremian–Aptian Tethyan carbonate system: New insights into the regional to global factors controlling the stratigraphic architecture of the Urgonian Provence platform (southeast France): Cretaceous Research, v. 91, p. 382–411, doi:10.1016/j.cretres.2018.05.002.
Tinker, S. W., 1998, Shelf-to-basin facies distributions and sequence stratigraphy of a steep-rimmed carbonate margin; Capitan depositional system, McKittrick Canyon, New Mexico and Texas: Journal of Sedimentary Research, v. 68, no. 6, p. 1146–1174, doi:10.2110/jsr.68.1146.
Vail, P. R., R. G. Todd, and J. B. Sangree, 1977, Seismic stratigraphy and global changes of sea level, part 5: Chronostratigraphic significance of seismic reflections, in Payton, C. E., ed., Seismic stratigraphy – Applications to hydrocarbon exploration: AAPG Memoir 26, p. 99–116.
van Buchem, F. S., M. I. Al-Husseini, F. Maurer, H. J. Droste, and L. A. Yose, 2010, Sequence-stratigraphic synthesis of the Barremian–Aptian of the eastern Arabian Plate and implications for the petroleum habitat: GeoArabia Special Publication 4, no. 4, p. 9–48.
van Buchem, F. S. P., B. Pittet, H. Hillgärtner, J. Grötsch, A. I. Al Mansouri, I. M. Billing, H. H. J. Droste, W. H. Oterdoom, and M. van Steenwinkel, 2002, High-resolution sequence stratigraphic architecture of Barremian/Aptian carbonate systems in northern Oman and the United Arab Emirates (Kharaib and Shu’aiba Formations): GeoArabia, v. 7, no. 3, p. 461–500.
van Buchem, F. S. P., P. Razin, P. W. Homewood, J. M. Philip, G. P. Eberli, J.-P. Platel, and J. Roger, et al., 1996, High resolution sequence stratigraphy of the Natih Formation (Cenomanian/Turonian) in northern Oman: Distribution of source rocks and reservoir facies: GeoArabia, v. 1, no. 1, p. 65–91.
van Buchem, F. S. P., M. D. Simmons, H. J. Droste, and R. B. Davies, 2011, Late Aptian to Turonian stratigraphy of the eastern Arabian Plate – Depositional sequences and lithostratigraphic nomenclature: Petroleum Geoscience, v. 17, no. 3, p. 211–222, doi:10.1144/1354-079310-061.
Vincent, B., F. S. P. van Buchem, L. G. Bulot, M. Jalali, R. Swennen, A. S. Hosseini, and D. Baghbani, 2015, Depositional sequences, diagenesis and structural control of the Albian to Turonian carbonate platform systems in coastal Fars (SW Iran): Marine and Petroleum Geology, v. 63, p. 46–67, doi:10.1016/j.marpetgeo.2015.02.018.
Warrlich, G., D. Bosence, D. Waltham, C. Wood, A. Boylan, and B. Badenas, 2008, 3D stratigraphic forward modelling for analysis and prediction of carbonate platform stratigraphies in exploration and production: Marine and Petroleum Geology, v. 25, no. 1, p. 35–58, doi:10.1016/j.marpetgeo.2007.04.005.
Williams, H. D., P. M. Burgess, V. P. Wright, G. Della Porta, and D. Granjeon, 2011, Investigating carbonate platform types: Multiple controls and a continuum of geometries: Journal of Sedimentary Research, v. 81, no. 1, p. 18–37, doi:10.2110/jsr.2011.6.
Yose, L. A., A. S. Ruf, C. J. Strohmenger, I. Al-Hosani, S. Al-Maskary, G. Bloch, Y. Al-Mehairi, J. S. Schuelke, A. Gombos, and I. G. Johnson, 2006, Three-dimensional characterization of a heterogeneous carbonate reservoir, Lower Cretaceous, Abu Dhabi (United Arab Emirates), in P. M. Harris and L. J. Weber, eds., Giant hydrocarbon reservoirs of the world: From rocks to reservoir characterization and modeling, AAPG Memoir 88, p. 173–212, doi:10.1306/1215877M882562.
AUTHORS
Jean Borgomano earned his Ph.D. in carbonate geology in 1987 from Aix-Marseille University, France. He worked for Shell International as a carbonate geologist in exploration–production (1988–2003). As a professor, he led the Carbonate Reservoir Laboratory at Aix-Marseille University. He worked as a carbonate expert at Total (2013–2015) and then returned as a professor at Aix-Marseille University. His research focuses on the characterization and geological–numerical modeling of carbonate reservoirs.
Cyprien Lanteaume received his Ph.D. in carbonate sedimentology and three-dimensional numerical modeling of reservoirs at the University of Aix-Marseille, France, in 2017. His research interests mainly focus on carbonate systems and reservoir modeling. He is currently employed as a consulting geologist at Modis Pau, France.
Philippe Léonide received his Ph.D. in sedimentology in 2007 from Aix-Marseille University, France. He joined the sedimentology and marine geology group at Vrije Universiteit Amsterdam (2009–2011). He is currently an assistant professor in carbonate sedimentology at Aix-Marseille University. His research focuses on the evolution of carbonates through time, which have importance for the characterization of petrophysical properties in the carbonate systems and reservoirs.
François Fournier received his M.Sc. degrees from the Nancy School of Mines (France) and from the Institut Français du Petrole and a Ph.D. in carbonate sedimentology from Aix-Marseille University, France. After experience in oil companies as an exploration geologist in France and Angola, he joined the carbonate reservoir team at Aix-Marseille University as an assistant professor in 2005. His research focuses on the relationship between sedimentology, diagenesis, and seismic expression of carbonate reservoirs.
Lucien F. Montaggioni, professor emeritus, obtained his Ph.D. in 1978 in sedimentology of Indian Ocean carbonate reef. He was a professor of geosciences at French University of the Indian Ocean, Réunion Island, between 1967 and 1988. Beginning in 1988, he became a professor at Aix-Marseille University and acted as head of the Department of Earth and Environment (1995–2003); his main research topics are marine geology and sedimentology of Cenozoic and modern carbonates, with a special interest in modern coral reefs.
Jean-Pierre Masse is a director of research at the French Research Council in Marseilles (France). He has spent most of his research time (since 1976) on Lower Cretaceous shelf carbonates throughout the world. His current research focuses on biostratigraphy and stratigraphy of the Urgonian carbonates.
ACKNOWLEDGMENTS
The project leading to this publication has received funding from the Excellence Initiative of Aix-Marseille University - A∗Midex, a French “Investissements d’Avenir” program.
The authors wish to thank Beicip-Franlab for providing the DionisosFlow software that was used for the stratigraphic forward modeling presented in this paper and four reviewers (J. Reijmer, G. Warrlich, M. Morsilli, and L. Pomar) for their constructive comments that helped to improve a previous version.