The AAPG/Datapages Combined Publications Database
AAPG Bulletin
Figure
AAPG Bulletin; Year: 2020; Issue: June DOI: 10.1306/0122201618217407
Return to Full Text
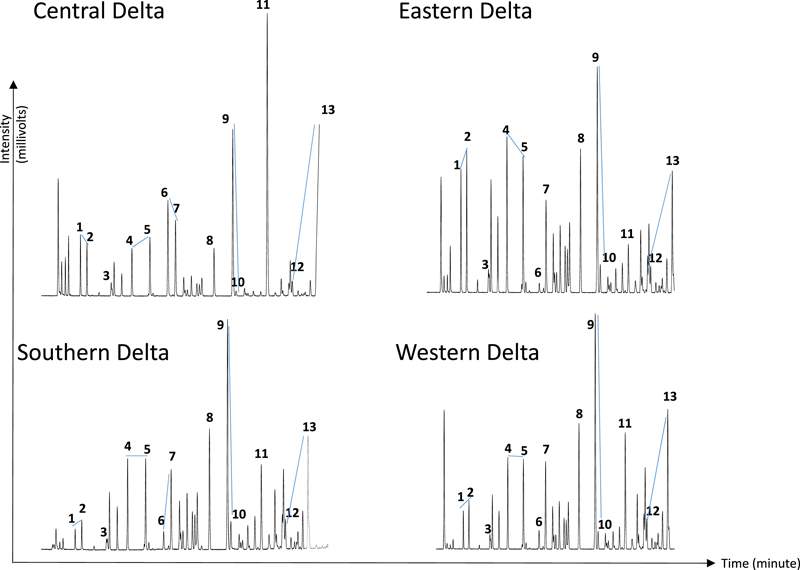
Figure 14. Representative partial whole oil gas chromatography–mass spectrometry total ion count chromatograms showing the light hydrocarbons from various regions of the Niger Delta. Note the differences in the relative peak intensities. Solid blue line shows peak variation and helps visual representation for comparison between areas of the delta. 1 = isopentane (C5 monobranched); 2 = n-pentane (C5 straight); 3 = cyclopentane (C5 cyclo); 4 = n-hexane (C6 straight); 5 = methylcyclopentane (C6 cyclo); 6 = benzene (C6 aromatic); 7 = n-heptane (C7 straight); 8 = cyclohexane (C6 cyclo); 9 = methylcyclohexane (C7 cyclo); 10 = 1-cis-2-dimethylcyclopentane (C7 cyclo); 11 = toluene; 12 = 3-methylheptane; 13 = n-octane.
Figure 14. Representative partial whole oil gas chromatography–mass spectrometry total ion count chromatograms showing the light hydrocarbons from various regions of the Niger Delta. Note the differences in the relative peak intensities. Solid blue line shows peak variation and helps visual representation for comparison between areas of the delta. 1 = isopentane (C5 monobranched); 2 = n-pentane (C5 straight); 3 = cyclopentane (C5 cyclo); 4 = n-hexane (C6 straight); 5 = methylcyclopentane (C6 cyclo); 6 = benzene (C6 aromatic); 7 = n-heptane (C7 straight); 8 = cyclohexane (C6 cyclo); 9 = methylcyclohexane (C7 cyclo); 10 = 1-cis-2-dimethylcyclopentane (C7 cyclo); 11 = toluene; 12 = 3-methylheptane; 13 = n-octane.