The AAPG/Datapages Combined Publications Database
AAPG Bulletin
Full Text
![]() Click to view page images in PDF format.
Click to view page images in PDF format.
AAPG Bulletin, V.
DOI: 10.1306/08192019076
Organic geochemistry and petrology of Devonian shale in eastern Ohio: Implications for petroleum systems assessment
Paul C. Hackley,1 and Robert T. Ryder2
1US Geological Survey (USGS), Reston, Virginia; [email protected]
2Retired, USGS, Reston, Virginia; [email protected]
ABSTRACT
Recent production of light sweet oil has prompted reevaluation of Devonian petroleum systems in the central Appalachian Basin. Upper Devonian Ohio Shale (lower Huron Member) and Middle Devonian Marcellus Shale organic-rich source rocks from eastern Ohio and nearby areas were examined using organic petrography and geochemical analysis of solvent extracts to test ideas related to organic matter sources, oil–source rock correlation, thermal maturity, and distances of petroleum migration. The data from these analyses indicate organic matter in the Ohio and Marcellus Shales primarily was derived from marine algae and its degradation products, including bacterial biomass. Absence of odd-over-even n-alkane distributions (n-C13 to n-C21 range) in gas chromatograms and low gammacerane index values in Devonian source rocks are similar to those of Devonian-reservoired oils in eastern Ohio, suggesting an oil–source rock correlation. Lower Paleozoic oils from eastern Ohio, in contrast, are characterized by the presence of odd-over-even n-alkane distributions (n-C13 to n-C21 range) and higher gammacerane values, which discriminate them from Devonian shale-derived oils. Thermal maturity estimates from equilibrium(?) biomarker isomerization ratios suggest that some of the Devonian source rock samples are at middle to peak oil window conditions (i.e., approximate vitrinite reflectance values of 0.8%–0.9%). This observation requires local to short-distance (<50 mi) lateral migration for emplacement of Devonian-sourced oils into Devonian reservoirs of eastern Ohio and may impact exploration and assessment of petroleum resources in the Upper Devonian Berea Sandstone.
INTRODUCTION
The emergence of the “shale revolution” in North America over the last two decades has resulted in a proliferation of geochemical and petrographic studies of shale source rocks in the context of their role as hydrocarbon reservoirs (e.g., Passey et al., 2010). Among other topics, investigators have examined thermal maturity, organic matter sources, and oil–source rock correlations (Jiang et al., 2001; Hill et al., 2007; Strąpoć et al., 2010; Bernard et al., 2012; Miceli Romero and Philp, 2012; Wood et al., 2015; Peters et al., 2016). Such studies have increased our understanding of the processes of hydrocarbon generation-expulsion, migration, and storage in the organic-rich shale reservoirs and enabled more efficient extraction of petroleum resources through the merging of horizontal drilling and hydraulic fracturing (Soeder, 2018).
Black shale source rocks and associated formations in the Devonian rock package of eastern Ohio were deposited in the Catskill clastic wedge as a response to the Appalachian orogeny on the eastern margin of the Appalachian foreland basin (Ettensohn, 2004). The Devonian black shales (Marcellus and Ohio) traditionally have been interpreted as representative of distal siliciclastic deposition in deep anoxic waters of the ancestral Appalachian Basin (Kepferle, 1993, and references therein). The overall black shale section dramatically thins westward from approximately 5000 ft thick in eastern Pennsylvania to approximately 600 ft thick in central Ohio (Roen, 1984). From its outcrop belt in central Ohio (Figure 1), the Ohio Shale dips southeastward into the subsurface Appalachian Basin (Figure 2) with thermal maturity increasing to the southeast with increasing burial depth (Rimmer et al., 1993; Repetski et al., 2008; East et al., 2012). The Marcellus Shale thins westward in the clastic wedge and pinches out in the subsurface into undifferentiated Hamilton Group (Ryder et al., 2008). Like the Ohio Shale, thermal maturity of the Marcellus Shale increases to the southeast in the subsurface. In eastern Ohio, the Ohio Shale is divided into the lower, organic-rich Huron Member and the overlying Three Lick Bed and Cleveland Member (Ohio Division of Geological Survey, 1990; de Witt et al., 1993). The Mississippian Sunbury Shale is located approximately 200 ft above the Ohio Shale (Figure 2). The Marcellus Shale is subdivided into multiple members by some researchers (e.g., in Pennsylvania, Kohl et al., 2014); however, our subsurface samples are undifferentiated.
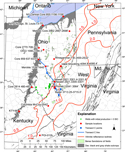 Figure 1. Map of study area showing sample locations, Devonian (Dev.) shale outcrop (Ryder et al., 2013), Dev. shale reflectance isolines from East et al. (2012), and oil fields in the Dev. Berea Sandstone. Oil wells with initial production > 0 bbl of oil in southern Ohio and Berea Sandstone oil field outlines are from publicly available online data from the Ohio, Kentucky, and West Virginia state geological surveys. Samples (red circles) are identified by name and depth in feet (‘). BO = barrels of oil; Md. = Maryland; NY = New York.
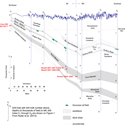 Figure 2. Transect C (Ryder et al., 2013) cross section showing southeastward dip of stratigraphic units into the Appalachian Basin. See Figure 1 for location of transect C cross section. Several of the samples examined herein (labeled in red) were collected from wells on this cross section. Sample Bailer 3713.25–3715.0 ft (Figure 1) was collected from a well adjacent to the cross section. From Ryder et al. (2013). Samples are identified by name and depth in feet (‘). Fm. = Formation; OH = Ohio; WV = West Virginia.
The objective of this paper is to evaluate petrographic data from Upper Devonian Ohio Shale (Huron Member) and Middle Devonian Marcellus Shale source rocks in eastern Ohio and nearby areas and the geochemical data generated from solvent extracts of these samples. In particular, we investigated the sources of organic matter, thermal maturity, and potential oil–source rock correlations in the immature to peak oil mature window. The timing of this work was influenced by recent US Geological Survey (USGS) assessments of undiscovered shale hydrocarbon resources in the Appalachian Basin (Higley et al., 2016; Enomoto et al., 2018) and characterization of the shallow Devonian Berea Sandstone petroleum system in nearby eastern Kentucky (Lupoi et al., 2017; Parris et al., 2019; other papers in this issue). Data sets used herein include the previous work of Hackley et al. (2013) and Ryder et al. (2013), which this paper builds on with analyses from additional samples and further evaluation of the geochemical data toward organic matter sources and oil–source rock correlations. As such, data sets and conclusions contained herein may overlap with these prior works. This paper extends study of Devonian petroleum system elements northward into eastern Ohio from eastern Kentucky where companion works include some of the other papers in this issue (Eble et al., 2021, this issue; Hackley et al., 2021, this issue; Parris et al., 2021, this issue).
PREVIOUS WORK
Milici and Swezey (2006) examined Devonian shale petroleum systems of the Appalachian Basin, including assessment of undiscovered resources contained in the Upper Devonian shale units examined herein. They noted that significant self-sourced oil and gas resources occurred west of the 0.6% vitrinite reflectance (VRo, in percent) isoline and attributed this apparent contradiction to VRo suppression, in which measured VRo values are lower than expected as compared with other thermal proxies or to the produced hydrocarbon products (e.g., Price and Barker, 1985; Carr, 2000). Milici and Swezey (2006) defined a Berea Sandstone assessment unit within their Devonian Shale‒middle and upper Paleozoic total petroleum system, which is not the same entity as the Berea Sandstone petroleum system more recently defined by Parris et al. (2019) in eastern Kentucky. That is, Milici and Swezey (2006) considered the Berea Sandstone assessment unit to constitute the volume of rock that contained hydrocarbon resources reservoired in Berea Sandstone. In contrast, Parris et al. (2019) considered the Berea Sandstone petroleum system to be all elements of the petroleum system (e.g., source, traps, migration pathways, reservoirs, etc.) related to the recent development of shallow unconventional hydrocarbon resources produced from the Berea Sandstone in eastern Kentucky.
Riley (2016) examined VRo and programmed pyrolysis data from the Devonian shale section in eastern Ohio and interpreted this data in the context of unconventional shale exploration. Riley concluded, as had previous researchers (e.g., Milici and Swezey, 2006; Repetski et al., 2008; East et al., 2012), that most of the area is immature for hydrocarbon generation given the conventionally accepted entrance to the economic oil window at approximately 0.6% VRo (Dow, 1977; Dembicki, 2009). For example, Repetski et al. (2008) and East et al. (2012) showed southwest- to northeast-trending VRo isolines in eastern Ohio with most of the area at VRo values < 0.6% (Figure 1). In easternmost Ohio, Riley (2016) showed a small strip of oil window to wet gas thermal maturity with VRo values of 0.6%–1.2% and a very small area in Jefferson County with VRo values > 1.2% at the approximate wet gas to dry gas transition. However, Devonian hydrocarbon production from eastern Ohio is mostly gas (Riley et al., 2004; described as thermogenic “dry gas” by Riley, 2016). Riley (2016) also attributed the mismatch between low reflectance values and production of dry gas to the phenomenon of VRo suppression. However, as described below, the occurrence of VRo suppression in upper Paleozoic marine shales is now considered unlikely and instead occurs because of misidentification of solid bitumen as vitrinite. Further, Devonian oil production is present in eastern Ohio (Figure 1; Cole et al., 1987; GeoMark, 2015), suggesting that VRo values are not as severely mismatched as production of dry gas from immature (VRo < 0.6%) conditions would suggest. Nevertheless, as observed by Hackley et al. (2021, this issue), production of hydrocarbons in areas of eastern Ohio where Devonian source rocks are immature according to VRo values requires (1) updip lateral migration from thermally mature source rocks; (2) vertical migration from underlying, thermally mature source rocks; (3) a reevaluation of the conventional 0.6% VRo entrance to the oil window for Devonian source rocks in eastern Ohio; or (4) reconsideration of the accuracy of VRo data available from eastern Ohio.
Prior to the shale revolution, Cole et al. (1987) presented the first comprehensive study of petroleum systems in eastern Ohio, including examination of oil–source rock correlations through geochemical analyses of source rock solvent extracts and oil samples. Their evaluation concluded the Ohio Shale was a good to excellent source rock and had contributed to oil accumulations in Silurian to Carboniferous reservoirs in eastern Ohio through long-distance, updip lateral migration from mature source kitchens to the east. They correlated oils from upper Paleozoic reservoirs to Ohio Shale source rocks based on high pristane to phytane (Pr/Ph) ratios and similarities in carbon isotopic character, concluding that the Mississippian Sunbury Shale was the principal source of Berea Sandstone oil in Ohio based on stratigraphic proximity. Furthermore, they observed upper Paleozoic oils to be distinct from lower Paleozoic-reservoired oils, which had strong odd-over-even carbon number predominance (from n-C13 to n-C21), lower Pr/Ph ratios, and were isotopically heavier. A later petroleum system study by Ryder et al. (1998), centered on Ohio, confirmed the distinct odd-over-even carbon number (from n-C11 to n-C19) predominance of lower Paleozoic-reservoired oils and solvent extracts from Ordovician source rocks.
More recently, Kroon and Castle (2011) examined organic matter sources, depositional environment, and thermal maturity of the lower Huron Member of the Ohio Shale in eastern Kentucky and adjacent West Virginia. Similar to the work herein, they used solvent extracts from immature to early mature source rocks to conclude that the organic matter was derived from marine algae and bacteria deposited in deep water (>150 m [492 ft]) under alternating oxic and anoxic conditions. From biomarker isomerization ratios, they observed an increase in thermal maturity to the southeast, similar to previous studies (Rimmer et al., 1993; Repetski et al., 2008).
Several previous works have examined the petrography and geochemistry of some of the same Devonian shale samples studied herein. An evaluation of thermal maturity on dip-oriented transects was based on several petrographic and geochemical parameters (Ryder et al., 2013). That work compared gas chromatography (GC) analyses of solvent extracts, organic matter type, spectral fluorescence of Tasmanites algae, and hydrogen index (HI) values with shale thermal maturity as determined by VRo and compared shale VRo with the VRo of overlying Pennsylvanian coalbeds (Ruppert et al., 2010). Observing that Devonian shale VRo values commonly were lower than the VRo values from overlying Pennsylvanian coalbeds, Ryder et al. (2013) proposed that lower VRo values from the Devonian shales were because of mistaken inclusion of lower-reflecting solid bitumen reflectance (BRo, in percent) measurements in VRo histograms. In contrast, the GC analyses, types of organic matter present, spectral fluorescence of Tasmanites algae, and HI values all suggested that shale thermal maturity was higher than determined via VRo and was more consistent with the VRo of the overlying coalbeds. Hackley et al. (2013) used sterane and terpane biomarker ratios to show that some of the eastern Ohio Devonian shale samples with VRo values <0.6% were indeed mature for oil generation. Hackley et al. (2013) also concluded that low VRo values were because of the mistaken identification of lower-reflecting solid bitumen as vitrinite. Recent experimental work (which included sample KTY-66 analyzed herein) confirmed that the maturation kinetics of vitrinite and solid bitumen are nonequivalent, with BRo increasing less than VRo when exposed to the same thermal stress (Hackley and Lewan, 2018). That experimental work provided additional evidence to suggest that the lower reflectance values found by previous researchers were indeed measurements of solid bitumen, rather than vitrinite. Other studies have evaluated reproducibility and correlation of petrographic thermal indices (reflectance, spectral fluorescence) for Devonian shale source rocks in the study area (Araujo et al., 2014a, b). These researchers observed good interlaboratory reproducibility for both petrographic parameters but found spectral parameters exaggerated thermal maturity relative to reflectance in some samples, also potentially suggesting the influence of solid bitumen measurements included in reflectance histograms for vitrinite. The application of new petrographic thermal index techniques to Devonian shales in the study area has included confocal laser scanning microscopy (Hackley and Kus, 2015) and Raman spectroscopy (Hackley and Lünsdorf, 2018). These studies provided empirical equations to relate values obtained from other thermal proxies (e.g., spectral maximum, Raman band separation) to a calculated BRo equivalent value.
Thus, previous works suggest (1) long-distance updip lateral migration occurred from thermally mature source rocks in the Devonian petroleum system of eastern Ohio (Cole et al., 1987); (2) vertical migration from underlying, thermally mature lower Paleozoic source rocks is unlikely based on geochemical evidence (Cole et al., 1987; Ryder et al., 1998); (3) there is no evidence to dispute that the conventional use of 0.6% VRo to mark the entrance to the commercial oil window is invalid in the study area; and (4) the establishment of the spatial location of this thermal boundary is complicated by the presence of lower-reflecting solid bitumen in the Devonian source rocks in eastern Ohio (Hackley et al., 2013; Ryder et al., 2013).
METHODS
Sample Materials and Selection
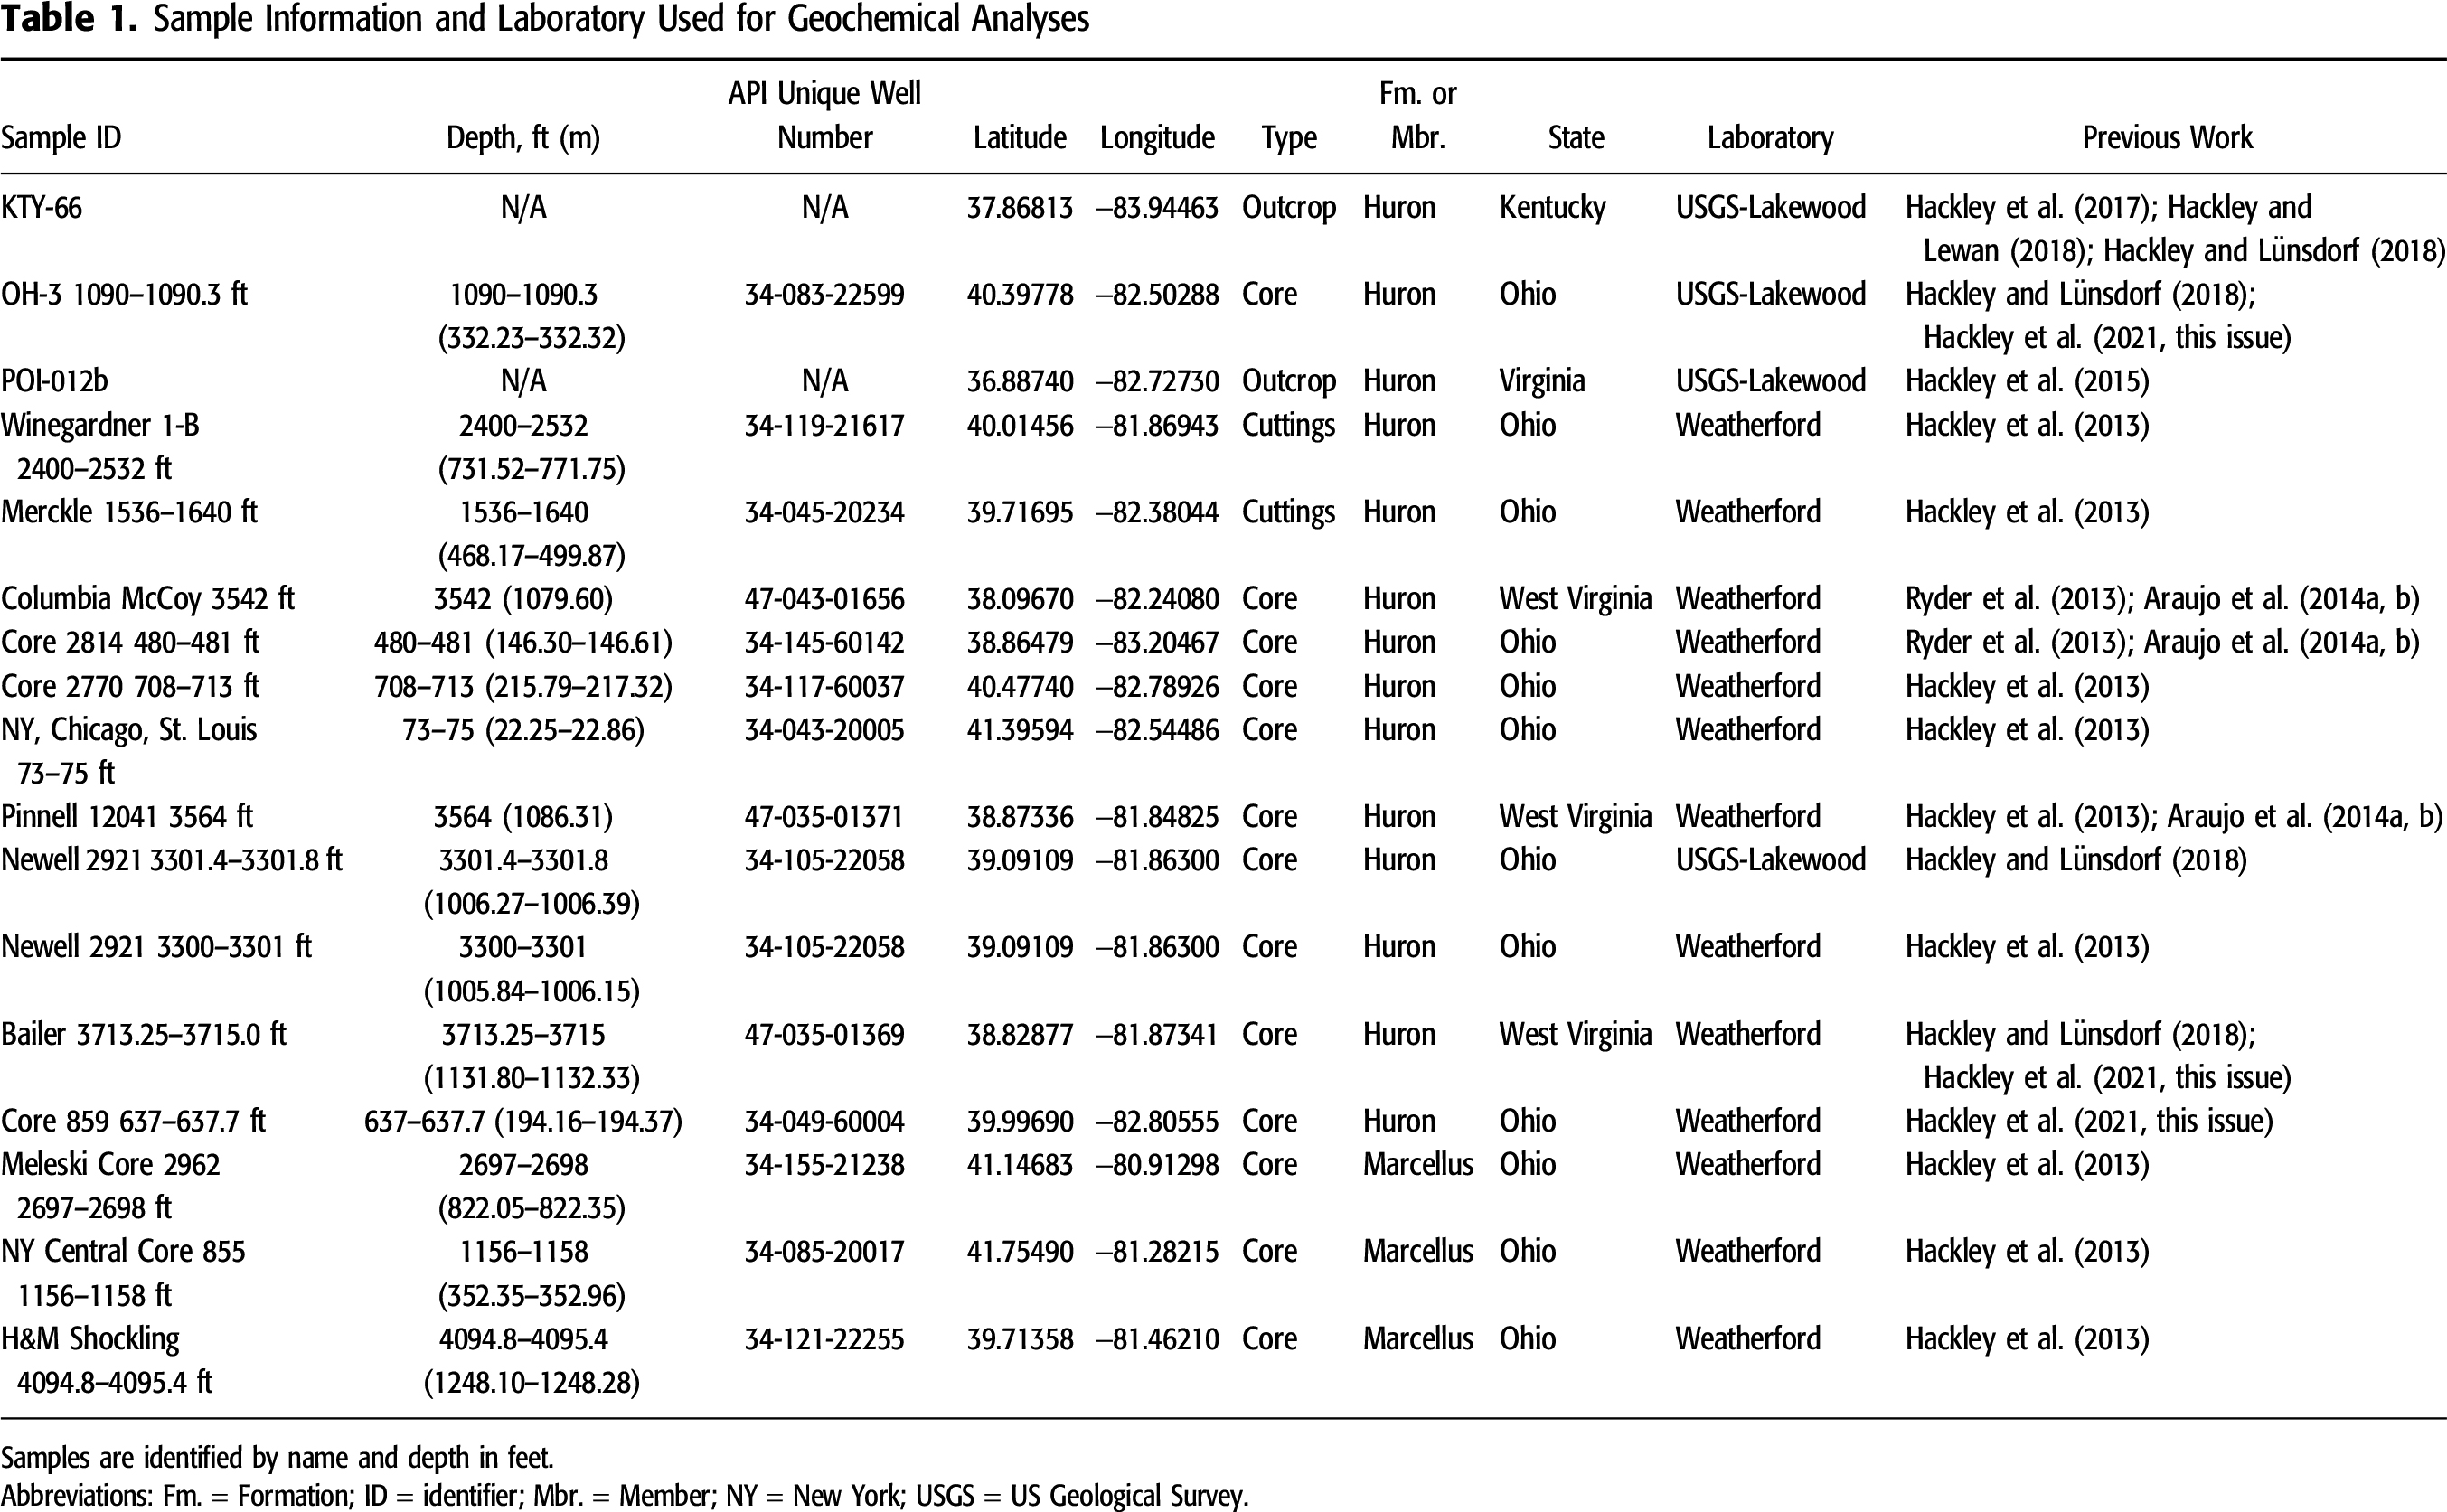
Samples are listed in Table 1 and include source rocks from eastern Ohio and parts of adjacent Kentucky and West Virginia. Samples were selected based on results from previous studies (Ryder et al., 2013), focusing on organic-rich samples up to peak oil window (BRo ∼1.0%) thermal conditions. The selection included 13 core samples, 2 cuttings samples, and 2 outcrop samples. These 17 rock samples were analyzed via organic petrography at USGS-Reston and via solvent extraction and geochemical characterization at Weatherford Laboratories and USGS-Lakewood. Geochemical analyses included programmed pyrolysis and solvent extraction followed by gravimetric column chromatography (USGS-Lakewood) or medium pressure liquid chromatography (MPLC, at Weatherford), GC–flame ionization detection (GC-FID), GC–mass spectrometry (GC-MS), and isotope ratio–mass spectrometry (IR-MS) measurements of solvent extracts. Table 1 indicates which laboratory performed the majority of geochemical analyses for each sample. Some results were reported in our previous works; this paper contains newly reported GC-MS and GC data for 8 samples, IR-MS carbon isotope data for 10 samples, and x-ray diffraction mineralogy data for 6 samples.
Petrographic Analyses
All petrographic analyses were performed at USGS-Reston. Samples were cast into thermoplastic briquettes, ground, and polished to a final stage of 0.05 μm abrasive per ASTM D2797 (ASTM International, 2015a). Pellets were imaged under oil immersion on a Zeiss AxioImager microscope in white and blue incident light. The BRo analyses were conducted on Leica DMRX polarizing microscope and Leica DM4000 microscopes following ASTM D7708 (ASTM International, 2015b). The DMRX polarizing microscope used a J&M MSP200 photomultiplier system and the DM4000 was equipped with LED illumination and monochrome camera detection using the computer program DISKUS-FOSSIL by Hilgers Technisches Buero. A yttrium–aluminum–garnet calibration standard (0.908% reflectance) from Klein and Becker was used for all analyses.
Geochemical Analyses
Geochemical analyses were conducted by two laboratories (Weatherford Laboratories and USGS-Lakewood) at different times, using different techniques and instruments. This approach is undesirable because of potential issues with data continuity and comparability. Nevertheless, the two-laboratory approach was unavoidable during the multiyear project because of sample availability and funding levels. As will be shown below, all results are broadly comparable, indicating the data are internally consistent. Furthermore, new geochemical data herein are consistent with extant oil analyses from Devonian shales of eastern Ohio contained in the commercial GeoMark (2015) database.
Analyses of total organic carbon (TOC) via LECO and programmed pyrolysis (all samples by Rock-Eval 2 using standard temperature program at Weatherford) followed conventional methods (Espitalié et al., 1985). A subset of select Huron samples was analyzed for mineralogy via x-ray diffraction of low temperature ash residues following Hosterman and Dulong (1989). Geochemical methods and procedures for solvent extraction, fractionation, GC-FID, and GC-MS analyses for shale samples analyzed at Weatherford were described earlier (Hackley et al., 2013). Stable carbon isotope ratios of extract fractions were measured in duplicate at Weatherford Laboratories by continuous low IR-MS analysis calibrated against NBS22 and converted to Peedee belemnite using the accepted value of −29.73‰ (Silverman, 1964). Precision specifications for stable carbon isotopes are ±0.15‰.
For geochemical analyses at USGS-Lakewood (Table 1), rock powders (∼10–40 g) were solvent extracted with chloroform in a Soxhlet apparatus for approximately 48 hr in the presence of solvent-cleaned copper strips for removal of elemental sulfur. Extracts were concentrated in rotary vacuum and filtered. A known extract volume fraction was dried and weighed to determine extractable organic matter concentrations of the original rock samples.
Weight fractions of C15+ saturates, aromatic, resins, and asphaltenes (SARA) and total C15− volatiles (V) were determined at USGS-Lakewood using 100 mg of extract de-asphaltened in 2 ml of iso-octane stored overnight at −20°C. Maltenes were separated with a 0.45-μm polytetrafluoroethylene syringe filter and reduced to 0.5 ml by evaporation under nitrogen. Asphaltenes were rinsed with chloroform and dried under nitrogen before weighing. Maltenes were fractionated by column chromatography using 5-ml serological pipettes filled with activated silica gel (grades 923 and 62) and activated alumina. Saturate, aromatic, and resin fractions were eluted with iso-octane, benzene, and a benzene/methanol azeotrope (60/40 weight for weight), respectively, and the solvent evaporated under nitrogen, followed by centrifugal vacuum. The C15− content of each extract was determined by evaporating 100-mg aliquots under nitrogen until dry, followed by centrifugal vacuum evaporation for 15-min intervals and reweighing until a weight difference of <0.3 mg was observed for three consecutive measurements. Recoveries for SARA + V were between 95 and 105 wt. % for all samples. Replicates showed agreement between all fractions to within 1–2 wt. %. Fractionation at Weatherford used MPLC, as previously described (Hackley et al., 2013).
Chromatograms from whole extracts, saturate, and aromatic fractions at USGS-Lakewood were determined using an Agilent Model 6890 gas chromatograph with a 60 m × 0.32 mm × 0.25 μm ZB-1 dimethyl-polysiloxane capillary column and flame ionization detector (GC-FID). The temperature program started at 40°C and increased at 4.5°C/min to 325°C, where it was held for 20 min. The helium carrier gas flow rate was 2.5 ml/min, and injection volume was 1 μl, using a splitless injection mode with an injection temperature of 325°C.
Biomarker concentrations at USGS-Lakewood were determined on the maltene fraction using a high-resolution JEOL GC Mate II magnetic sector mass spectrometer (GC-MS). The temperature program started at 50°C and was ramped to 150°C at 50°C/min, followed by 3°C/min ramp to 339°C, and held for 5 min. The helium carrier gas flow rate was 2 ml/min. Ions examined were mass-to-charge ratio (m/z) 191, 217, 231, and 253. Perfluorokerosene was used as a tuning compound, and an in-house oil standard was used for quality control purposes in peak selection. Biomarker analysis by GC-MS methods at Weatherford used the saturate fraction, as previously described (Hackley et al., 2013).
Stable carbon isotopic composition of oil C15+ saturate and aromatic fractions were determined at USGS-Lakewood using a Thermo Flash 2000 elemental analyzer coupled to a Thermo MAT253 isotope ratio mass spectrometer via a Thermo Conflo IV. Samples were flash combusted at 1020°C in a chromium oxide–filled quartz reactor, and combustion gases passed over copper at 600°C to reduce NOx components and remove excess oxygen. Water was removed by Mg(ClO4)2, and CO2 and N2 separated at 90°C by GC (CarboSieve-G, 1 m × 5 mm). Carbon isotope values are reported in delta notation (δ13C, ‰) on the Vienna Peedee belemnite scale and represent an average of duplicate analyses generally with a standard deviation of 0.2‰ or less.
RESULTS AND DISCUSSION
Petrography
Reflectance measurements for 11 of the samples examined herein were previously reported as measurements of VRo (Hackley et al., 2013; Ryder et al., 2013; Araujo et al., 2014a, b). Careful reexamination of these samples indicates that the organic matter is dominated by solid bitumen, and it is therefore considered that the previously reported measurements were of BRo, as suggested by Hackley et al. (2013) and Ryder et al. (2013). More recent work on the remainder of the samples contained herein has documented that reflectance measurements were conducted exclusively on solid bitumen (Hackley et al., 2017; Hackley and Lewan, 2018).
The BRo measurements in this study (including previously reported values) range from 0.35% to 0.96% (Table 2), indicating immature to peak oil window conditions, assuming BRo is less than (at immature conditions) or equal to (at peak oil conditions) VRo (Eble et al., 2021, this issue). The BRo values in the Huron samples range from 0.35% to 0.80%, whereas BRo values in the Marcellus samples range from 0.52% to 0.96%. As described by previous organic petrographic works in the central Appalachian Basin Devonian shales, immature conditions in the organic assemblage are dominated by amorphous organic matter with variable fluorescence (called bituminite by Kus et al., 2017 and Pickel et al., 2017) and pre-oil solid bitumen (Robl et al., 1987, 1992; Taulbee et al., 1990; Rimmer et al., 1993, 2004, 2015; Ryder et al., 2013; Araujo et al., 2014a, b; Hackley and Cardott, 2016). Bituminite occurs as low contrast gray to brown (in white incident light under oil immersion) groundmass material intimately dispersed in the mineral matrix (Figure 3A, B) and as elongate schlieren and structureless masses. Pre-oil solid bitumen (Jacob, 1989) occurs as homogeneous, low-gray void-filling and groundmass forms (Figure 3C, D). Bituminite converts to pre-oil solid bitumen during diagenesis and thermal advance, and the two organic matter types occur in a continuous and gradational series. There are no infallible guidelines or practical methods to make distinctions between solid bitumen and bituminite, although most studies seem to rely on reflectance values > 0.3% for confident identifications of solid bitumen (Hackley et al., 2018).
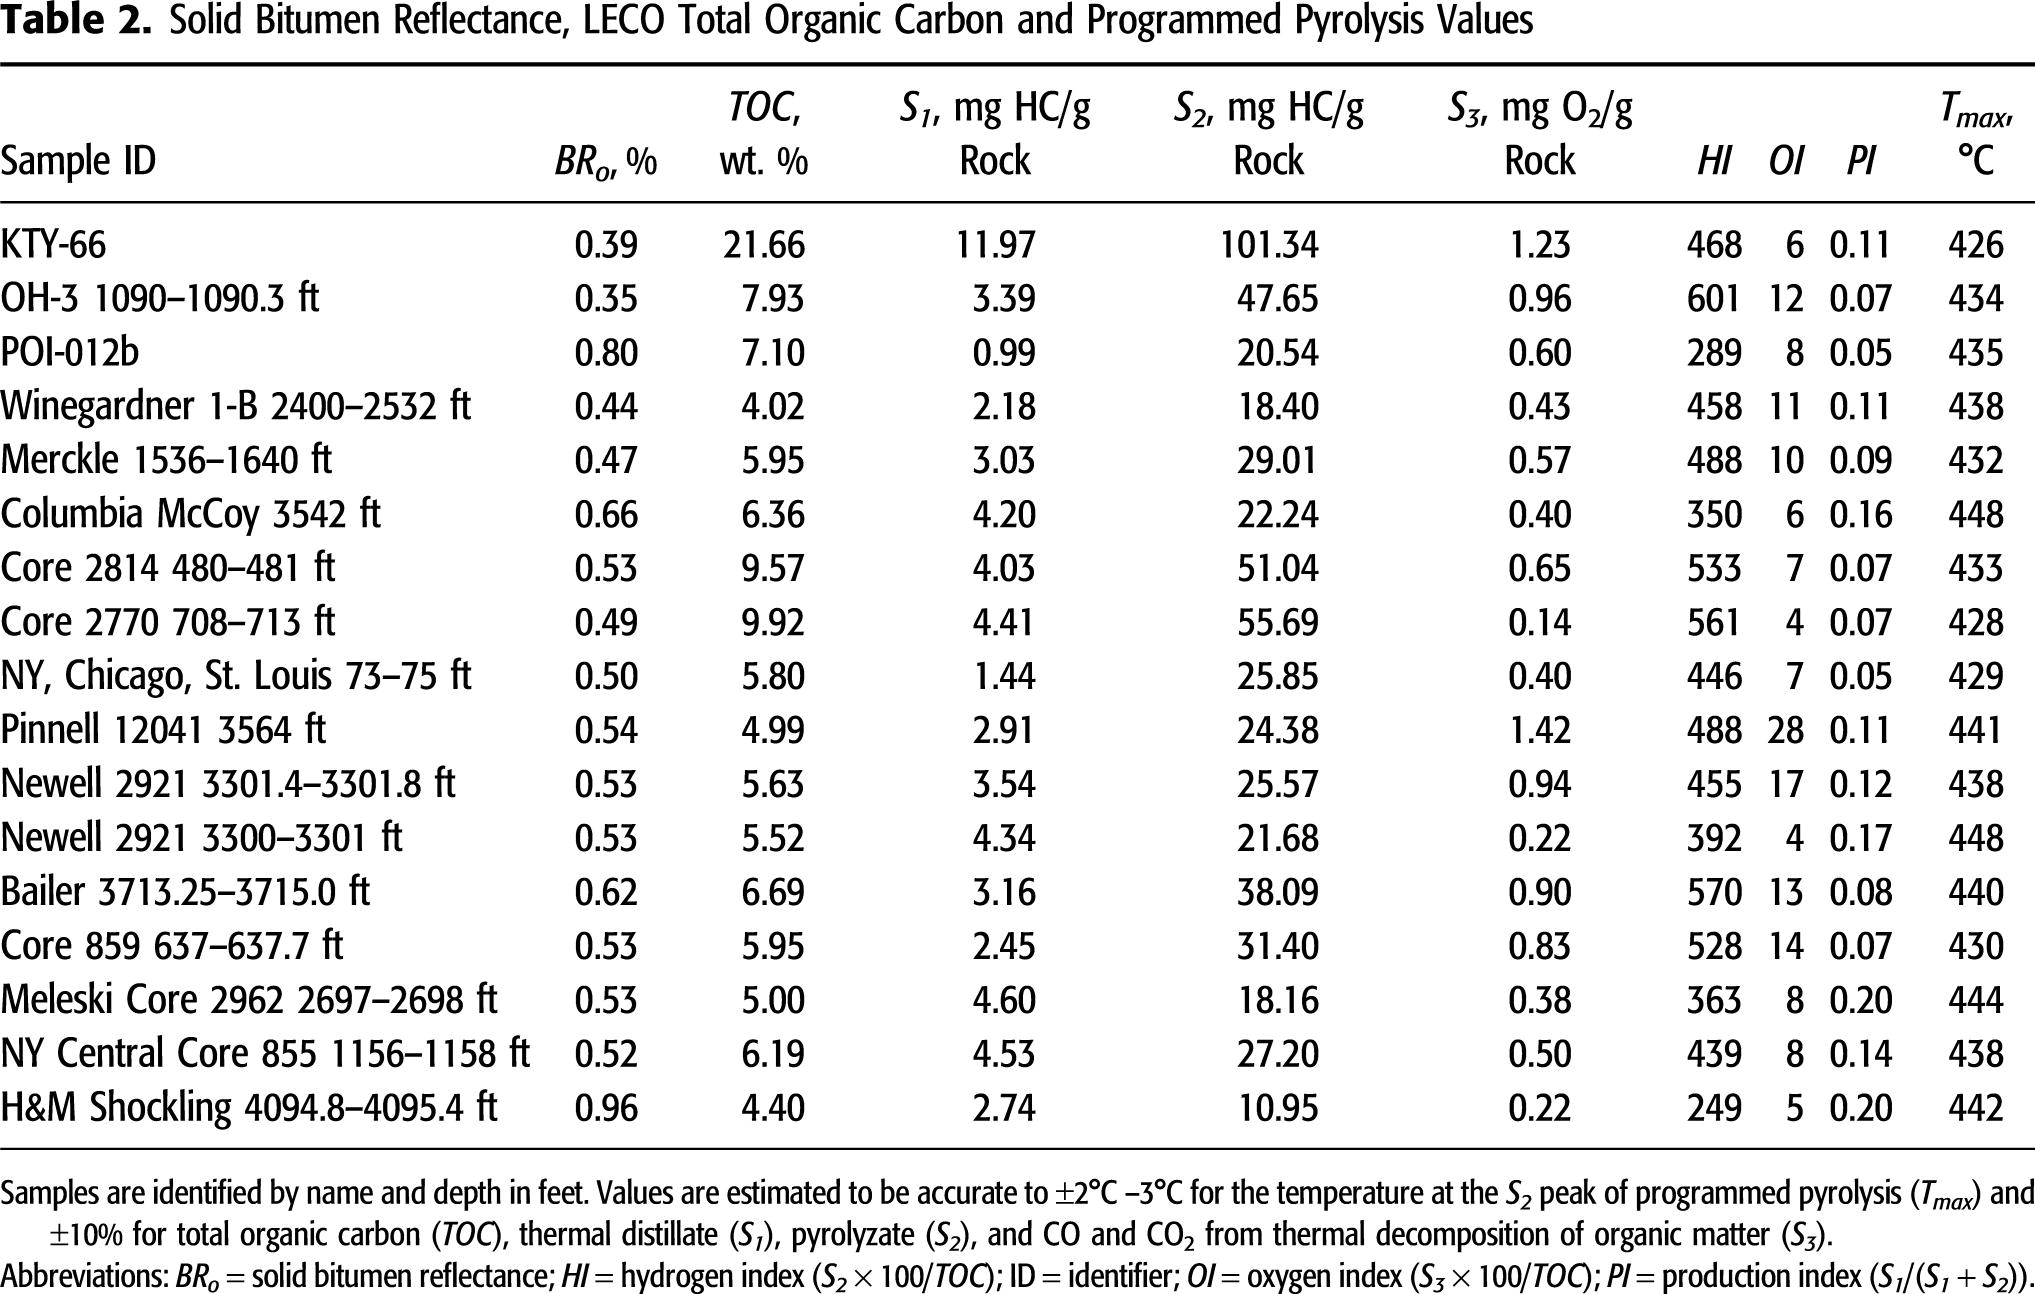
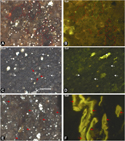 Figure 3. Organic petrography images of Huron samples. (A) Sample OH-3 1090–1090.3 ft showing groundmass regions of bituminite (amorphous organic matter) outlined in red. Incident white light under oil immersion. (B) Same field as (A) under epifluorescence. (C) Sample KTY-66 showing groundmass regions of solid bitumen with gray reflecting surface (white arrows) and euhedral carbonate (red arrows). Incident white light under oil immersion. (D) Same field as (C) under epifluorescence. (E) Sample Bailer 3713.25–3715 ft showing Tasmanites (red arrows). Incident white light under oil immersion. (F) Same field as (E) under epifluorescence.
Most samples contain Tasmanites alginite (Hackley et al., 2017), with some of the samples analyzed herein containing Tasmanites in abundance (Figure 3E, F). In samples from oil window thermal maturity conditions (as determined by BRo values > 0.6%), the abundance and fluorescence intensity of amorphous kerogen and Tasmanites diminish, Tasmanites develops a gray reflecting surface, and the abundance of solid bitumen increases. At close to peak oil thermal maturity conditions (>0.9% BRo), amorphous kerogen and Tasmanites are absent (Ryder et al., 2013) and solid bitumen dominates the organic assemblage (Hackley and Cardott, 2016). A small proportion of the organic matter assemblage is detrital fragments of inertinite, carbonized remnants of woody land plants. The presence of inertinite suggests vitrinite should also be present because of proximity to a terrigenous source of debris from higher plants. However, no conclusive identifications of vitrinite were made, and therefore measurements of VRo could not be determined.
Bulk Rock Analyses
Mineralogy of Huron samples is dominated by quartz (33–55 wt. %) and clay minerals (23–59 wt. %) according to the results of x-ray diffraction analyses (Table 3). Carbonate is present in some samples, for example, 24 wt. % in sample KTY-66 (Table 3) as confirmed by petrography (Figure 3C).
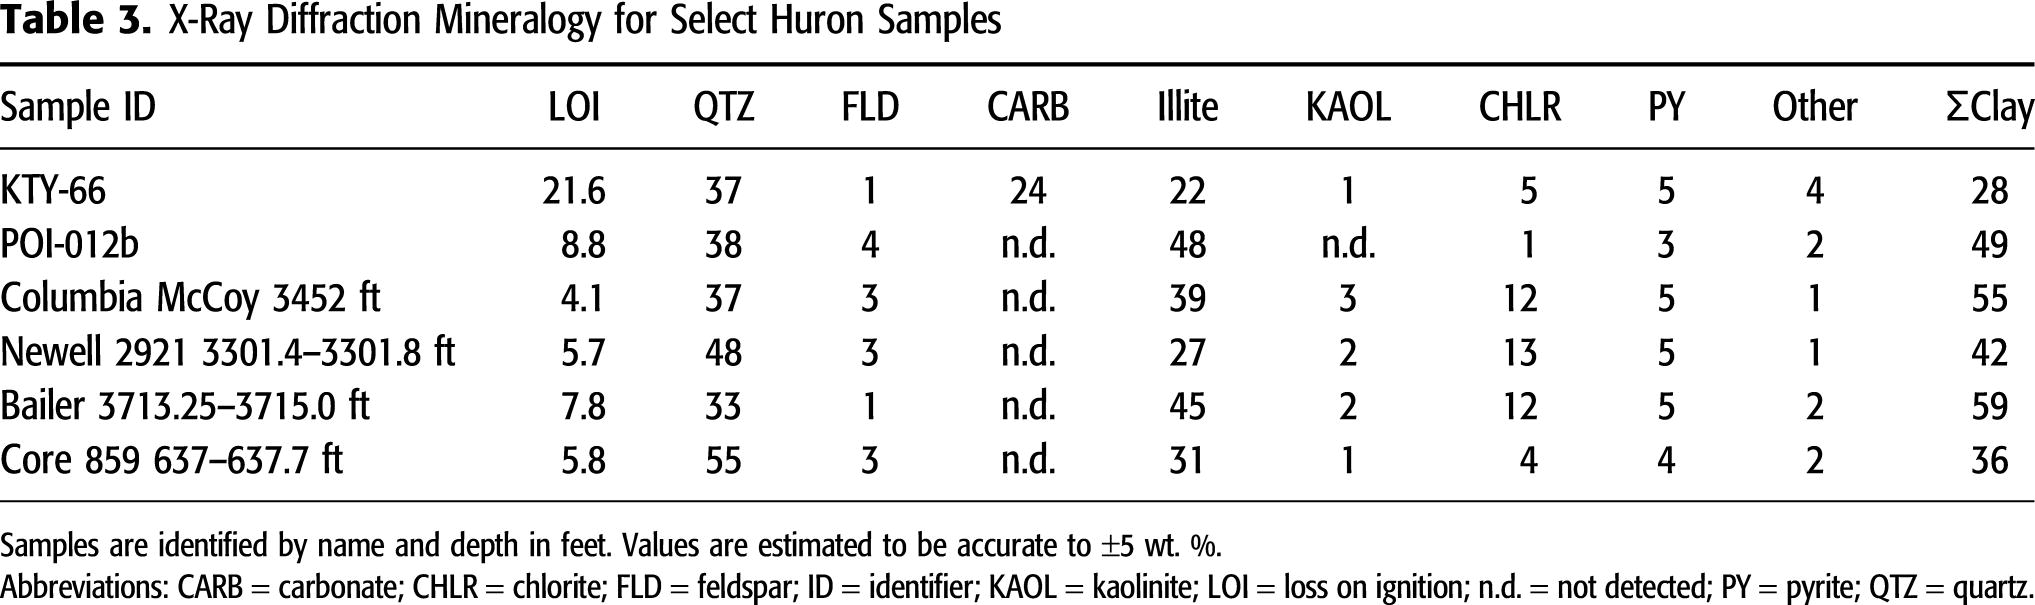
The LECO TOC content and programmed pyrolysis values are compiled in Table 2. Consistent with loss-on-ignition values from low temperature ashing (Table 3), LECO TOC values range from 4.02 to 21.66 wt. %, indicating high organic matter abundance in all samples. The HI values range from 249 to 601 mg of hydrocarbons/gram of TOC and show a moderate negative linear correlation (coefficient of determination [R2] = 0.55) with BRo values, suggesting hydrogen loss through conversion of aliphatic oil-prone organic matter to a mobile saturate-rich petroleum. The position of samples in the modified Van Krevelen chart (Figure 4) is consistent with the presence of a highly aliphatic type I/II marine organic matter as demonstrated by organic petrography. The temperature at the S2 peak of programmed pyrolysis (Tmax) values range from 426°C to 448°C, indicating the samples range from immature to oil window thermal maturity conditions (Figure 5).
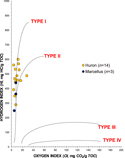 Figure 4. The hydrogen index (HI, S2×100/total organic carbon [TOC] in milligrams of hydrocarbons per gram of TOC) versus oxygen index (OI, S3×100/TOC in milligrams of CO2 per gram of TOC) modified Van Krevelen chart. The kerogen type evolution lines are based on multiple sources (Espitalié et al., 1985; Peters, 1986; Hart and Steen, 2015).
 Figure 5. Plot of hydrogen index (HI, S2×100/total organic carbon [TOC] in milligrams of hydrocarbons per gram TOC) versus the temperature at the S2 peak of programmed pyrolysis (Tmax) (°C) showing evolution of kerogen composition with thermal maturity. Maturation boundaries are based on Peters and Cassa (1994) and Baskin (1997). The kerogen type evolution lines are based on Espitalié et al. (1985) and Hart and Steen (2015).
Column and Liquid Chromatography
Solvent extraction and SARA fractionation results are compiled in Table 4. Some extractions were not quantitative, and poor recovery during fractionation of some samples prevented examination of the complete data set for relationships with thermal maturity or comparison to extant data. Similar to solvent extracts from Sunbury and Ohio Shale samples from eastern Kentucky (Hackley et al., 2021, this issue), solvent extract samples in this study show a broad range of values with high resin plus asphaltene components (Figure 6). Also included in Figure 6, for comparison, are average bulk SARA properties of Devonian Berea Sandstone and Ohio Shale-reservoired (n = 23) and lower Paleozoic-reservoired (n = 35) oils from eastern Ohio (data from GeoMark, 2015) and outlines showing the range of compositions for these oil families.
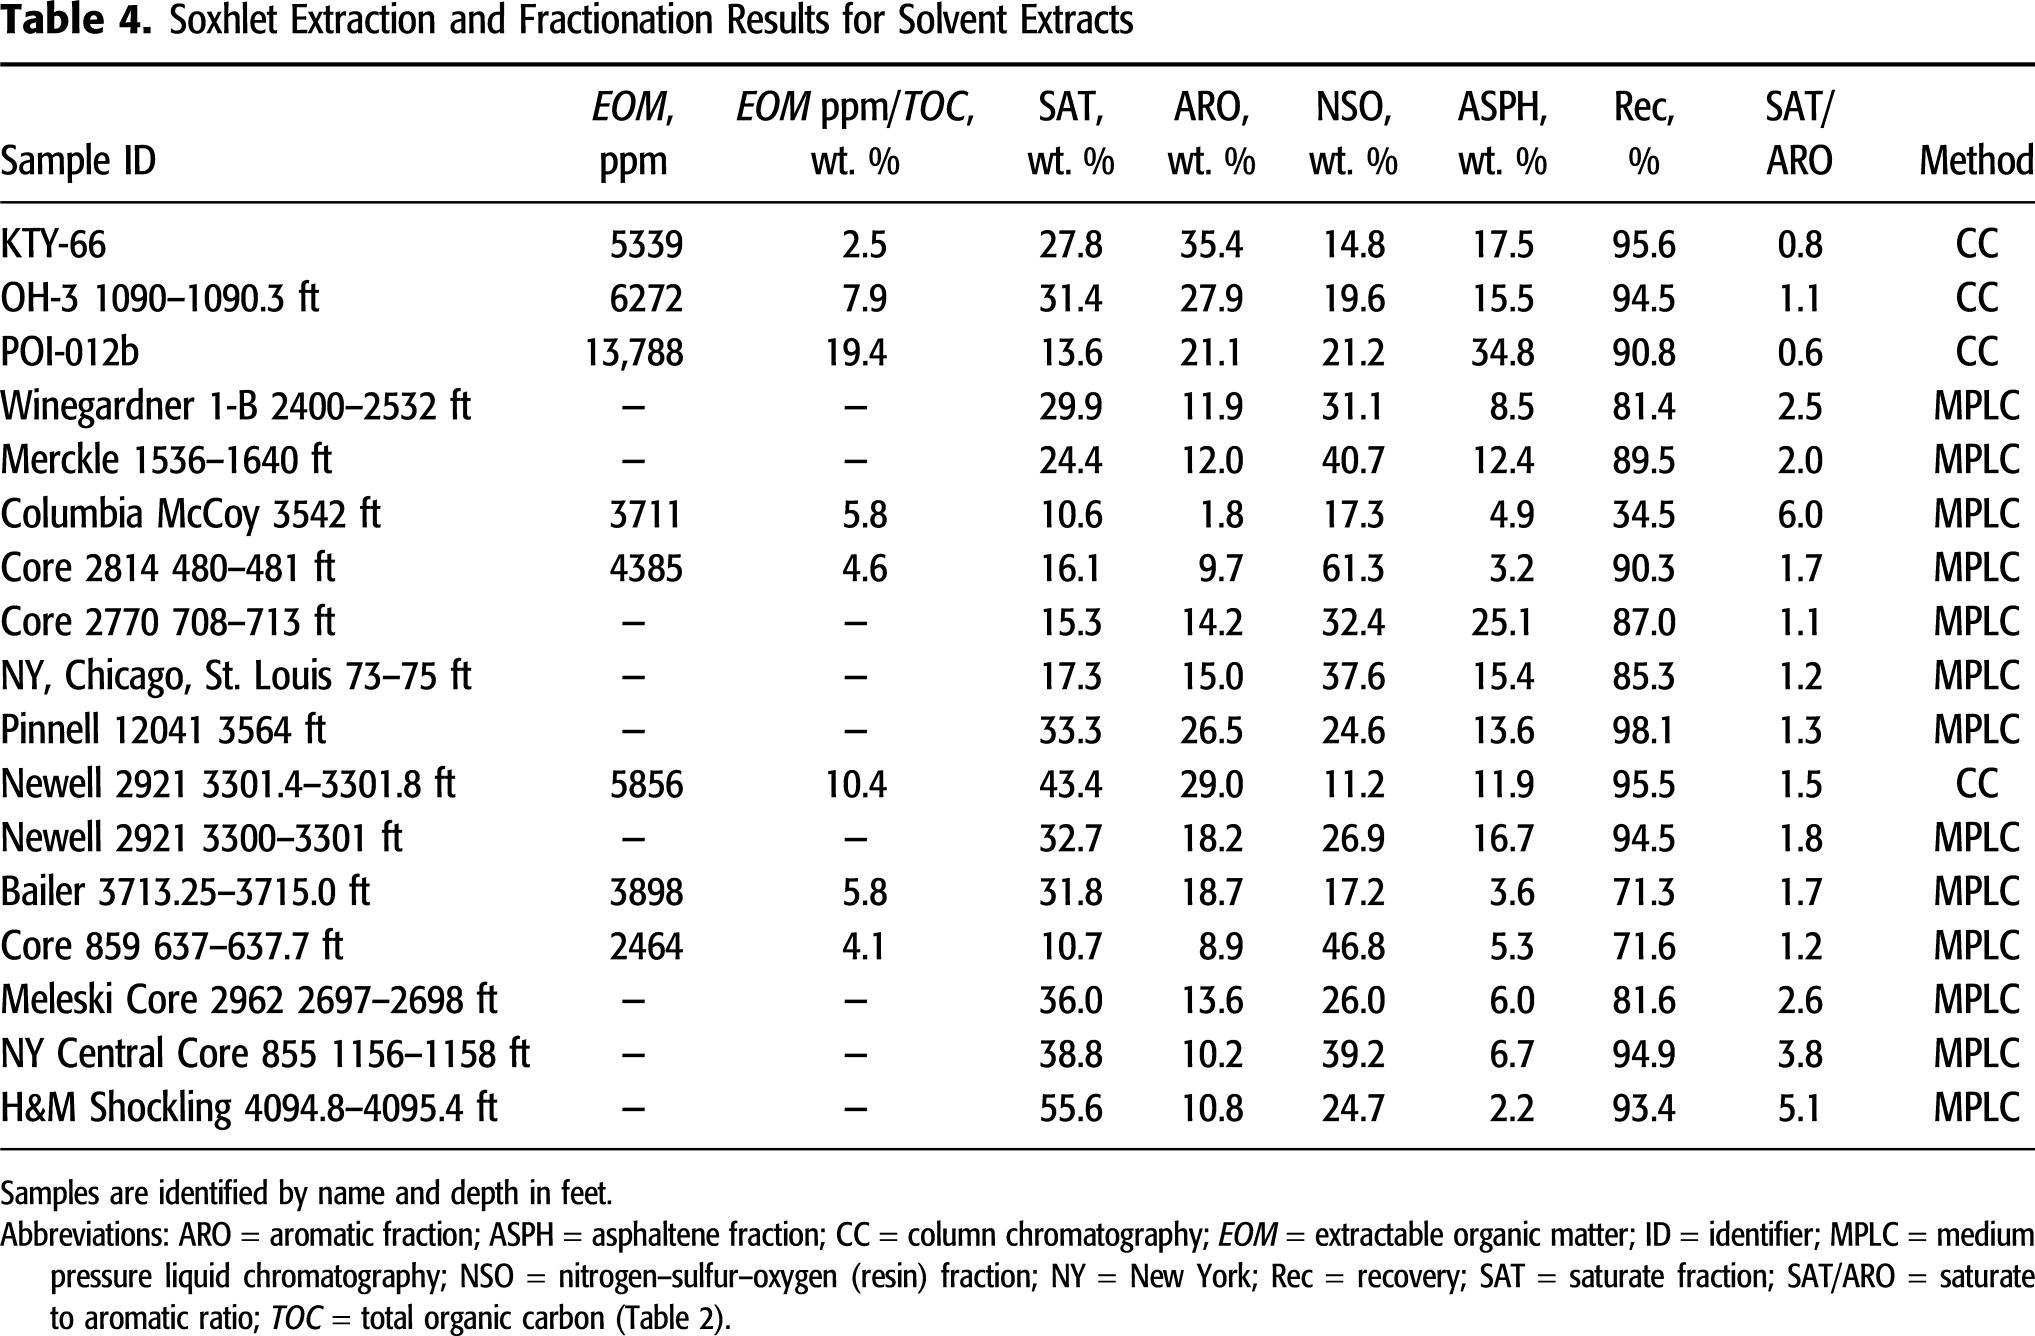
 Figure 6. Ternary plot of normalized solvent extract C15+ saturates, aromatic, resins, and asphaltenes results from gravimetric column chromatography (US Geological Survey-Lakewood) and medium pressure liquid chromatography (Weatherford). Data for eastern Ohio Devonian and lower Paleozoic samples from GeoMark (2015); Huron and Marcellus data (dots) from this study. Arom = aromatic; avg. = average; NSO+Asph = resins plus asphaltenes; Sat = saturate.
Gas Chromatography
Solvent extract samples exhibit little evidence of biodegradation as confirmed through relative absence of unresolved complex mixture, low Pr/n-C17 and Ph/n-C18 ratios, and the consistency of n-alkane envelopes. Chromatograms generally are unimodal with maxima at n-C12–15 (Figure 7). A secondary maximum is present at n-C27 in sample Core 859 637–637.7 ft; this is the only sample in this study with a secondary maximum. Petrography indicated abundant Tasmanites in sample Core 859 637–637.7 ft, consistent with the presence of abundant long-chain n-alkanes (e.g., Dutta et al., 2013); however, other samples (e.g., sample Bailer 3713.25–3715.0 ft), also contain abundant Tasmanites, yet do not show the n-C27 secondary maximum. A slight hump from unresolved complex mixture centered at n-C34–35 is present in most chromatograms. Little or no difference is observed between Huron and Marcellus chromatograms, and, with the exception of sample Core 859 637–637.7 ft, n-alkane envelopes are similar across the thermal maturity range of the samples.
 Figure 7. Solvent extract chromatograms (whole extracts) for select samples from gas chromatography–flame ionization detection. Numbers indicate number of carbon atoms. All chromatograms, except sample Core 859 637–637.7 ft, are from Ryder et al. (2013). BRo = solid bitumen reflectance; Co. = County; IP = isoprenoid; NC = n-alkane; PHEN = phenanthrene; UCM = unresolved complex mixture; WV = West Virginia.
The Pr/Ph ratios range from 1.2 to 2.3, consistent with marine organic matter sources from environments subject to periodic oxidation (Didyk et al., 1978). Carbon preference index (CPI) values range from 0.46 to 1.07 (Table 5), consistent with mature organic matter (Bray and Evans, 1961). Low CPI values for several samples are uncharacteristic and caused by poor GC-FID response, whereas the remainder are more typical and fall in the range of 0.9 to 1.1. Isoprenoid to normal alkane ratios Pr/n-C17 and Ph/n-C18 for solvent extract samples plot in the mixed terrigenous-marine organic matter area of the discrimination diagram (Figure 8; Shanmugam, 1985; Hunt, 1996). Although this may reflect the small component of terrigenous organic matter observed by organic petrography, it is more likely caused by periodic oxidizing conditions as also suggested by moderate Pr/Ph ratios of 1.2–2.3 (Didyk et al., 1978). Kroon and Castle (2011) also suggested alternating oxic-anoxic conditions based on isoprenoid and hopane ratios. Isoprenoid to n-alkane ratios plot close to an average value (n = 23) of oils from Ohio Shale and Berea Sandstone reservoirs in eastern Ohio and generally have higher ratios than the average value (n = 36) of oils from lower Paleozoic reservoirs in eastern Ohio (data from GeoMark, 2015). Ratios also are similar to Berea oils and Sunbury (Mississippian) and Ohio Shale solvent extracts from eastern Kentucky (Hackley et al., 2021, this issue). Terrestrial to aquatic ratios (TAR (n-C27 + n-C29 + n-C31)/(n-C15 + n-C17 + n-C19); Bourbonniere and Meyers, 1996) are low (generally <0.20), with the exception of sample Core 859 637–637.7 ft, which has the unusual bimodal n-alkane envelope and TAR = 1.57, and sample New York Central Core 855 1156–1158 ft, which has TAR = 0.28.
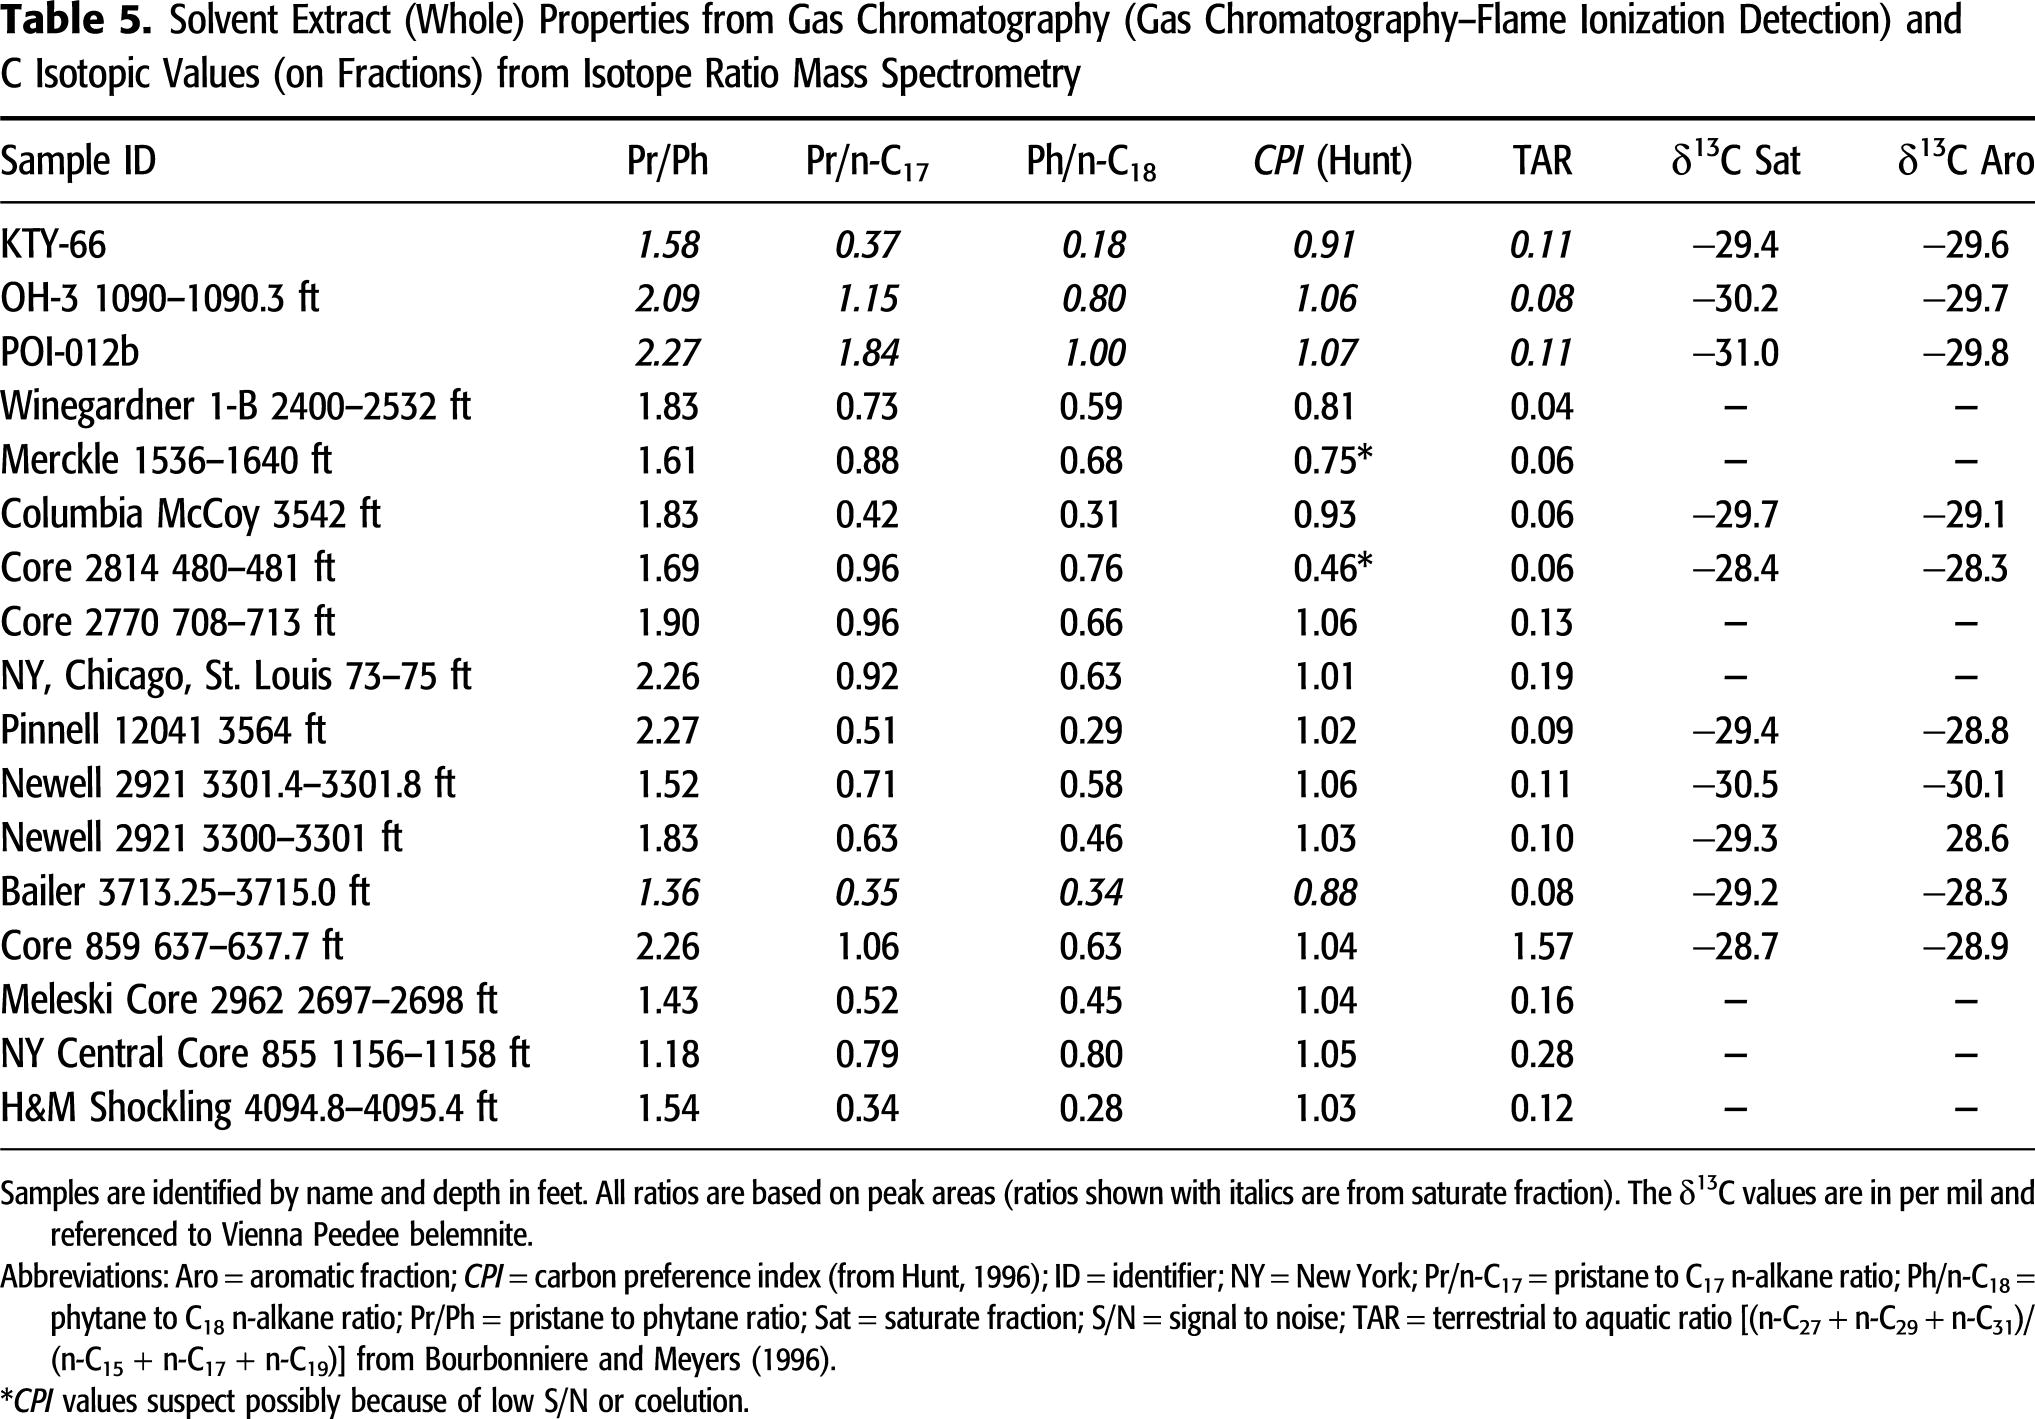
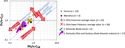 Figure 8. Pristane (Pr)/n-C17 and phytane (Ph)/n-C18 discriminant plot. Data fields for eastern (E.) Kentucky Ohio Shale and Sunbury Shale solvent extracts and Berea oils from Hackley et al. (2021, this issue). Average Berea- and Ohio Shale–reservoired (n = 23) and lower Paleozoic-reservoired (n = 36) oil from E. Ohio according to data from GeoMark (2015) shown for comparison. Organic source fields and process directions after Shanmugam (1985). Huron and Marcellus data (dots) from this study.
Carbon Isotope Composition
Solvent extract carbon isotopic values from the saturate and aromatic fractions are compiled in Table 5 for the 10 Huron samples evaluated in this study; Marcellus extracts were not analyzed for C isotopic ratios. When the Huron carbon isotopic values are discriminated in a Sofer-type plot (Sofer, 1984), all values plot in the marine sector (Figure 9). Solvent extracts show a moderate range of carbon isotopic compositions but plot close to the average compositions of Devonian- and lower-Paleozoic–reservoired oils from eastern Ohio (GeoMark, 2015). Huron extracts also are similar to Berea oils and solvent extracts from eastern Kentucky (Hackley et al., 2021, this issue).
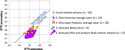 Figure 9. Sofer-type plot of δ13C isotopic composition (Sofer, 1984) of the saturated and aromatic hydrocarbon fractions of Huron member solvent extracts in this study. The diagonal line separates waxy oil (derived from terrigenous organic matter) from nonwaxy oil (derived from marine organic matter). Average Berea and Ohio Shale-reservoired (n = 23) and lower Paleozoic-reservoired (n = 34) oil from eastern (E.) Ohio according to data from GeoMark (2015) shown for comparison. Data fields for E. Kentucky Ohio Shale and Sunbury Shale solvent extracts and Berea oils from Hackley et al. (2021, this issue); Huron data (dots) from this study.
Biomarker Characterization from Gas Chromatography–Mass Spectrometry
Sterane and hopane biomarker ratios from GC-MS analysis of solvent extracts are compiled in Table 6. As noted above, differences in the GC-MS methods used at USGS-Lakewood and Weatherford may result in differences in biomarker ratios. However, systematic differences in biomarker ratios are not present within the data set when comparing ratios determined for similar maturity samples between the two laboratories, although the sample population size is too small for statistical tests. The data set also is broadly consistent with extant data from eastern Ohio Devonian oil samples (reservoired in Berea Sandstone and Ohio Shale) analyzed in yet a third laboratory (GeoMark Research, Ltd; Hackley et al., 2021, this issue) as indicated in Figures 10–12.
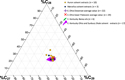 Figure 10. Ternary plot of normal sterane (5α, 14β, 17β [20S], m/z 218) distributions. Average Berea and Ohio Shale-reservoired (n = 22) and lower Paleozoic-reservoired (n = 29) oil from eastern (E.) Ohio shown for comparison. Data from GeoMark (2015). Data fields for E. Kentucky Ohio Shale and Sunbury Shale solvent extracts and Berea oils from Hackley et al. (2021, this issue). Huron and Marcellus data (dots) from this study.
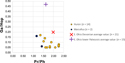 Figure 11. Plot of gammacerane index (ratio of gammacerane to 17α, 21β-hopane [Ga/Hop]) versus pristane/phytane (Pr/Ph) for Berea oils and solvent extracts. Data for average (n = 21) eastern (E.) Ohio Devonian oil and lower Paleozoic oil (n = 15) from GeoMark (2015); Huron and Marcellus data (dots) from this study.
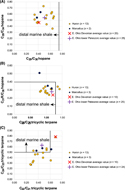 Figure 12. Plots of tricyclic terpane and hopane ratios. Data for average eastern (E.) Ohio Devonian and lower Paleozoic oil from GeoMark (2015); Huron and Marcellus data (dots) from this study.
As noted by Hackley et al. (2021, this issue), previous work by Cole et al. (1987) did not resolve sterane and hopane biomarkers in eastern Ohio oil samples, which they suggested was because of high thermal maturity and poor signal resolution. However, work by Hackley et al. (2013) on some of the same samples described herein obtained well-resolved biomarker ratios, which were used to examine thermal indices. As illustrated in Hackley et al. (2013; their figures 2, 3), solvent extract fragmentograms show well-resolved peaks.
Normal sterane [5α, 14β, 17β (20S), m/z 218] distributions are shown in Figure 10. Huron and Marcellus solvent extracts are tightly clustered and highest in the C29 component, similar to other studies of oils derived from Devonian marine shale source rocks (Grantham and Wakefield, 1988). Most extract sterane distributions are similar to distributions in average (n = 22) Berea and Ohio Shale oil and lower Paleozoic oil (n = 29) from eastern Ohio computed from the GeoMark (2015) database, where the average oil compositions show approximately 30% C27, 25% C28, and 45% C29. There is the possible exception of three samples from this study that contain approximately 10% less of the C29 component and 5% to 10% more of the C28 component than the average sterane abundances from the GeoMark database. The solvent extracts also are similar to Berea oils and Sunbury and Ohio Shale solvent extracts from eastern Kentucky (Hackley et al., 2021, this issue) as shown in Figure 10. Other biomarker parameters (Table 6) are presented in the following sections.
Sources of Organic Matter
The unimodal n-alkane distributions with predominance of short-chain (<C15) components are consistent with a marine organic matter source (Blumer et al., 1971) and reinforce the notion of distal marine deposition in a deep anoxic basin setting (Kohl et al., 2014). Little or no difference in bulk organic composition is suggested by GC-FID differences between the Huron and Marcellus. The Pr/Ph ratios of 1.2–2.3 also are consistent with marine organic matter (e.g., Zhang and Huang, 2005) and low TAR values. The TAR value of 0.28 in sample New York Central Core 855 1156–1158 ft is not significantly different than most of the other samples; however, the unusual high TAR value in sample Core 859 637–637.7 ft with bimodal n-alkane signature may reflect presence of a drilling mud contaminant introduced during coring or collection (Ryder et al., 2013) or plasticizers introduced during analysis (Hackley et al., 2021, this issue).
The CPI values of approximately 1 generally are interpreted as indicating thermally mature organic matter (e.g., Bray and Evans, 1961; Hunt, 1996). Because most of the samples examined herein are thermally immature or only marginally mature, their CPI values close to unity (generally 0.9–1.1, Table 5) also are consistent with a dominant marine component to the organic matter.
Petrographic observations indicate a dominant marine organic matter component for the Devonian shale in Ohio, and therefore the C29 sterane contribution is likely to represent marine organic matter such as photosynthetic planktonic green algae (e.g., marine phytoplankton that may synthesize precursors to C29 steranes; Volkman, 1986). Previous researchers have suggested C29 steranes represent a terrigenous contribution to the organic matter (Mackenzie et al., 1982) and minor land-plant organic matter (vitrinite and inertinite) is present, as described above and elsewhere (e.g., Eble et al., 2021, this issue). However, this terrigenous organic matter is a minor component compared with marine algae (e.g., Tasmanites) and algal biodegradation products (bituminite), and the observed sterane distributions are consistent with a mixed planktonic-bacterial input as indicated in the discrimination diagrams of previous researchers (e.g., Huang and Meinschein, 1979; Mohialdeen et al., 2013) and by previous biomarker studies in the lower Huron (Kroon and Castle, 2011).
Low gammacerane index values of 0.05–0.17 (Figure 11; Table 6) indicate normal mesohaline (nonstratified, low to normal marine salinity) conditions were present (Sinninghe Damsté et al., 1995) during deposition of Ohio and Marcellus Shale source rocks. These gammacerane index values are slightly lower than the average value for eastern Ohio Devonian oils and significantly lower than the average value for eastern Ohio lower Paleozoic oils reported by GeoMark (2015).
Norhopane to hopane ratios (Moldowan et al., 1991) are <0.75, consistent with a distal marine siliciclastic environment (Peters et al., 2007) and broadly similar to the compositions of Devonian and lower Paleozoic oils in eastern Ohio (Figure 12A; Table 6). Ratios of C27 rearranged to regular steranes (C27 diasterane/ααα sterane; Table 6) range from 0.55 to 2.62, consistent with low-maturity, clay mineral–rich (Table 2) marine source rocks (e.g., van Kaam-Peters et al., 1998). Tricyclic terpanes (Figure 12B; Table 6) are presumed to originate from Tasmanites algae (Azevedo et al., 1992) or from prokaryotic (bacterial) membranes (Ourisson et al., 1982). As described above, Tasmanites is present in all of the immature Devonian shale samples in this study along with bituminite derived from bacterial degradation of the original algal organic matter (e.g., Kus et al., 2017). Tricyclic terpane ratios also are similar to tricyclic terpane ratios of eastern Ohio Devonian and lower Paleozoic oils. With minor exceptions, the C31R/H and C26/C25 ratios shown in Figure 12B are consistent with a distal marine siliciclastic setting (Peters et al., 2007). The C24/C23 tricyclic terpane ratios lower than 0.5 (Figure 12C) may reflect a minor carbonate influence (Aquino Neto et al., 1983; Peters et al., 2005) in some of the Devonian shales analyzed in this study, as confirmed by petrography showing euhedral carbonates (Figure 3C, D), detection of carbonate in x-ray diffraction mineralogy analyses (Table 3), and from total carbon analyses (Eble et al., 2021, this issue). Most C22/C21 tricyclic terpane ratios are lower than 0.60, consistent with a distal marine setting (Peters et al., 2007). With the exception of one sample, most extract C24/C23 and C22/C21 tricyclic terpane ratios are significantly lower than the average value for eastern Ohio Devonian oils and similar to the average of lower Paleozoic oils from eastern Ohio (Figure 12C).
Oil–Source Rock Correlation
Cole et al. (1987) argued that oils in upper Paleozoic reservoirs of eastern Ohio were sourced from the Ohio and Sunbury Shales based on higher Pr/Ph ratios, lighter carbon isotopic composition, and absence of odd-over-even n-alkanes predominance (n-C13 to n-C21 range) compared with lower Paleozoic source rocks. They preferred the Sunbury as the primary source rock for Berea Sandstone oils because of stratigraphic proximity but were not able to provide convincing geochemical evidence. In eastern Kentucky, Hackley et al. (2021, this issue) also could not identify an individual source rock for Berea Sandstone oils, concluding that any of the Upper Devonian to Mississippian source rocks evaluated (lower and upper Huron, Cleveland, and Sunbury) could have contributed to oil accumulations.
Figure 11 indicates that Pr/Ph ratios are similar (1.60–2.00) between average eastern Ohio lower Paleozoic oils and average Devonian oils (Figure 11), although the average value for Devonian oils is slightly higher as reported by Cole et al. (1987). However, the Pr/Ph values in this study span the range from 1.18 to 2.27 (Table 5) and thus are not useful for distinguishing between sources of lower Paleozoic and Devonian oils. A second parameter, the absence of odd-over-even n-alkanes predominance (n-C13 to n-C21 range) in gas chromatograms of Devonian shale extracts (Figure 7) and oils, does discriminate the source rocks of this study from lower Paleozoic oils and source rocks (Cole et al., 1987; Ryder et al., 1998), however, the wide range in carbon isotopic compositions (Figure 9) does not, although the average Devonian oil is isotopically lighter, also as previously reported by Cole et al. (1987). Furthermore, the close correspondence between normal sterane distributions of Ohio and Marcellus Shale source rock solvent extracts with those in eastern Ohio oils as observed in Figure 10 is consistent with Devonian shales being the source of the reservoired oils. However, similarity in sterane distributions between the Devonian and Ordovician oils does not allow use of sterane distributions to distinguish a source rock for eastern Ohio oils. With the possible exception of C24/C23 and C22/C21 tricyclic terpane ratios (Figure 12C), broad similarities in C26/C25 tricyclic terpane and C29/C30 hopane ratios between the average compositions of lower Paleozoic and Devonian oils from eastern Ohio also seem to preclude using these parameters for oil–source rock correlation. Devonian oils on average have higher C24/C23 and C22/C21 tricyclic terpane ratios than lower Paleozoic oils; however, most of the Devonian shale solvent extracts examined herein were more similar to the average of lower Paleozoic oils (Figure 12C).
In contrast, lower gammacerane index values in the Devonian shale solvent extracts appear to rule out a Devonian source for lower Paleozoic oils (Figure 11). Moreover, similarities between gammacerane index values of Devonian shale solvent extracts and Devonian oils are consistent with the eastern Ohio Devonian oils, such as reservoired in the Berea Sandstone being sourced from Ohio Shale and Marcellus Shale source rocks. Summarizing, gammacerane index values are consistent with eastern Ohio Devonian shale as the source of Devonian oils and inconsistent with Devonian shale as the source of lower Paleozoic oils, which appear to be sourced from strata deposited under more stratified conditions. Thus, lower gammacerane index values, in addition to absence of odd-over-even n-alkanes (n-C13 to n-C21 range) in Devonian oils appear to preclude vertical migration from underlying, thermally mature lower Paleozoic source rocks into Devonian reservoirs. Use of other compositional parameters for oil–source rock correlation is prohibited by broad similarities between eastern Ohio Devonian and lower Paleozoic oils (GeoMark, 2015). More work is needed to determine if other compositional parameters could be used to improve oil–source rock correlations in the study area.
Thermal Maturity
As described above, most BRo values are <0.6% (Table 2), suggesting many of the source rock samples examined herein are immature with respect to oil generation (assuming BRo is similar to VRo). However, Eble et al. (2021, this issue;) showed BRo is consistently lower than co-occurring VRo values in Devonian shale source rocks from eastern Kentucky. These scientists showed that average BRo values from wells of immature to early oil window conditions were less than average VRo values by approximately 0.14%–0.17%, similar to previous results (Hackley et al., 2013; Ryder et al., 2013; Hackley and Lewan, 2018). Based on these previous case studies and experiments, many of the samples examined herein are likely to be in the early oil window despite BRo values < 0.6%. When 0.14%–0.17% is added to the values of BRo reported in Table 2, all but two to three values become greater than the typically accepted value of 0.6% for the threshold to oil window thermal conditions (Dow, 1977). This may suggest BRo values of approximately 0.45% indicate onset of oil window conditions in the Devonian shale source rocks from eastern Ohio. Consistent with this assumption, many Tmax values are >435°C for samples with BRo > 0.45% (Table 2), again indicating early oil window conditions (Peters, 1986).
Ryder et al. (2013) considered that HI values < 400 mg of HC/g of TOC also may be a good indicator of the onset of oil window thermal maturity conditions. However, we note here that many samples that we consider mature from BRo or Tmax measurements have HI values > 400 (Table 3), indicating this threshold may not always apply or may be more closely tied to organic matter type and abundance.
Although this paper does not contain enough new data to influence significant redrafting of the thermal maturity isolines of Repetski et al. (2008) and East et al. (2012) in eastern Ohio, the companion paper by Eble et al. (2021, this issue) does contain updated VRo and Tmax isolines for eastern Kentucky. These isolines project into southeastern Ohio, showing placement of the 0.5% reflectance isoline may occur significantly westward of the placement by East et al. (2012). The observation that areas previously thought to be immature based on their position westward of the 0.5% VRo isoline may be mature for oil generation has implications to future assessment of undiscovered resources in the Berea Sandstone. For example, Milici and Swezey (2006) considered the westward extent of mature source rock as a limitation when placing undiscovered resource volumes in their Berea Sandstone assessment unit. A similar approach was adopted by Enomoto et al. (2018) for assessment of undiscovered resources in Upper Devonian shales of the Appalachian Basin. Recognition that mature source rocks are present farther west into Ohio may result in estimates of greater resource volumes and higher confidence limits placed on such estimates. In addition, this recognition may open further exploration potential for Berea Sandstone oil accumulations in eastern Ohio.
The C27 trisnorhopane epimer ratios (Ts/Ts+Tm, Table 6; Seifert and Moldowan, 1978) show a moderate positive correlation with the C29 ββ/(ββ+αα) sterane isomerization ratio (R2 = 0.72, Figure 13A). The relationship between Ts/Ts+Tm and the C29 20S/(20S+20R) isomer ratio is not as robust (R2 = 0.59), although the correlation improves to 0.75 when outlier sample Bailer 3713.25–3715.0 ft is excluded. The Ts/Ts+Tm ratio also shows a strong relationship to C27 diasterane/sterane ratios (R2 = 0.83, Figure 13B), similar to relationships observed in the Devonian of eastern Kentucky (Hackley et al., 2021, this issue). Because both ratios are dependent on organic source and depositional environment (Moldowan et al., 1986; Mello et al., 1988), in addition to thermal maturity, their correspondence suggests all samples contain similar organic source material as discussed above. Ts/Ts+Tm ratios show no relationship to measured BRo or programmed pyrolysis results, unfortunately preventing an empirical calibration between them. Ts/Ts+Tm ratios range 0.26–0.73 for Huron samples and 0.70–0.78 for Marcellus samples, indicating, in general, immature to peak oil thermal maturity conditions (Peters et al., 2005; Kroon and Castle, 2011).
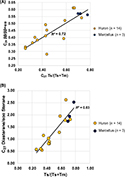 Figure 13. (A) Plot of C29 ββ/(ββ+αα) sterane isomerization ratio versus C27 trisnorhopane epimer ratio (Ts/Ts+Tm) from the solvent extracts of this study. (B) Plot of C27 diasterane/ααα sterane versus C27 trisnorhopane epimer ratio (Ts/Ts+Tm) from the solvent extracts of this study. R2 = coefficient of determination; Ts/(Ts+Tm) is 18α, 21β-22,29,30-trisnorneohopane/Ts + 17α, 21β-22,29,30-trisnorhopane.
Sterane isomerization ratios from some of the same samples examined herein were used by Hackley et al. (2013) to show that the samples were indeed mature for oil generation. For example, the ααα 20S/(20S+20R) isomer ratios of C29 steranes are expected to approach an empirical thermal equilibrium value of approximately 0.55, which occurs in the early to middle oil window at VRo values of approximately 0.8% (Seifert and Moldowan, 1986; Peters et al., 2005). In our sample set, the equilibrium C29 ααα 20S/(20S+20R) isomer ratio is either not reached or is reached but is slightly lower than reported elsewhere (maximum values of 0.51–0.53, Table 5), perhaps because of issues with coelution (e.g., Seifert and Moldowan, 1986) or preferential expulsion of the S epimer (e.g., Jiang et al., 1988). Samples that are clearly mature for oil generation according to BRo values > 0.6% and Tmax values > 435°C (Table 3) have C29 ααα 20S/(20S+20R) isomer ratios ≤ 0.51 (Table 6). Although there is the potential for reversal from equilibrium at higher thermal maturity, this effect typically is restricted to the unusual thermal regime of hydrous pyrolysis experiments or contact metamorphism (Lewan et al., 1986; Bishop and Abbott, 1993).
Isomer ratios for C29 ββS/(ββS+ααS) (or ββR/[ββR+ααR]) steranes are reported to reach an empirical thermal equilibrium value of approximately 0.70 at an equivalent VRo value of approximately 0.9% (Seifert and Moldowan, 1986; Peters et al., 2005). None of the samples in this study (Table 6) approach the C29 ββ/(ββ+αα) empirical equilibrium value of 0.70, even though measured BRo values are as high as 0.96% in sample H&M Shockling 4094.8–4095.4 ft (Table 3). The highest C29 ββ/(ββ+αα) values of 0.61 occur in samples Newell 2921 3300–3301 ft and Bailer 3713.25–3715.0 ft, which have BRo of 0.53% and 0.62%, respectively.
The C29 ββ/(ββ+αα) and C29 ααα 20S/(20S+20R) ratios show poor correlation when the entire data set is considered (R2 = 0.44, logarithmic). Removing sample Bailer 3713.25–3715.0 ft with poor signal to noise improves the correlation coefficient to 0.64 (Figure 14). When considering samples from only USGS-Lakewood (using C29 ββR/ββR+ααR), the correlation to ααα 20S/(20S+20R) is 0.94, and when considering samples only from Weatherford (using C29 ββS/ββS+ααS) it is 0.87, suggesting that the isomerization data set is internally consistent (at least when considering data from individual laboratories). This suggests sterane isomer ratios are useful as thermal maturity parameters in the early to middle oil window for Appalachian Basin Devonian shales (Hackley et al., 2013; 2021, this issue).
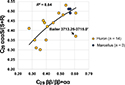 Figure 14. Plot of C29 ααα 20S/(20S+20R) versus C29 ββ/(ββ+αα) sterane isomerization ratios from the solvent extracts of this study. The outlier sample Bailer 3713.25–3715 ft is not included in the logarithmic regression. R = right-handed enantiomer; R2 = coefficient of determination; S = left-handed enantiomer.
As indicated above, the cluster of samples at the high thermal maturity end of the sterane isomerization trend (Figure 14) may suggest C29 ααα 20S/(20S+20R) equilibrium occurs at approximately 0.51–0.53. It is less likely that C29 ββ/(ββ+αα) equilibrium has been reached because few samples have appropriate BRo or Tmax values. Nevertheless, samples with the highest C29 ββ/(ββ+αα) values of 0.56–0.61 have BRo values from 0.52% up to 0.96%, production index values of 0.08–0.20, and Tmax values of 438°C–448°C, suggesting a range of maturities that extend to the empirical isomerization equilibrium. Similar maxima of approximately 0.51 for C29 ααα 20S/(20S+20R) and approximately 0.63 for C29 ββ/(ββ+αα) equilibrium also were observed by Hackley et al. (2021, this issue) for Devonian Berea oils and solvent extracts in eastern Kentucky. Therefore, it appears that equilibrium values for sterane isomerization, particularly C29 ββ/(ββ+αα), may be slightly lower in the Devonian petroleum system of the central Appalachian Basin than cited in other petroleum-producing basins (e.g., Mackenzie, 1984; Grantham, 1986; Rullkötter and Marzi, 1988; Chandra et al., 1994; Johnson et al., 2003; Pang et al., 2003; Schwab et al., 2005; Yang et al., 2017; Burton et al., 2018; among many other examples). An alternative explanation is that isomerization ratios are affected by issues related to coelution in our data sets (e.g., Seifert and Moldowan, 1986) or show preferential expulsion of the ββ and S sterane epimers (Fan and Philp, 1987; Jiang et al., 1988).
Unfortunately, sterane isomerization ratios show no relationship to measured BRo values or thermal proxies from programmed pyrolysis. That is, Devonian shale samples with presumed isomer equilibrium values have equivalent BRo values to samples with nonequilibrium values. This feature of the data set precludes establishment of empirical calibrations between isomerization ratios and other thermal maturity parameters and is possibly caused by small numbers of samples, natural variability, mixing of geochemical data from two laboratories, or poor signal to noise or other unknown issues with data quality, for example, Tmax suppression (Snowdon, 1995) as reviewed by Eble et al. (2021, this issue) for the study area.
Migration
Assuming the highest sterane isomerization ratios are at thermal equilibrium, the data suggest thermal maturities are higher than suggested by measured BRo values and are closer to approximate VRo values of 0.8%–0.9% (Peters et al., 2005; their figure 14.3). This observation is consistent with the reflectance information reported by Eble et al. (2021, this issue) showing that VRo values are consistently higher than co-occurring BRo values. Therefore, the data presented herein may suggest it is not necessary to invoke long-range (>50 mi) lateral migration in eastern Ohio. That is, oils reservoired in the Devonian of eastern Ohio may be sourced from nearby Devonian Marcellus and Ohio Shale source rocks, rather than requiring significant updip lateral migration from a distant (>50 mi) source kitchen “deep within the Appalachian Basin” as concluded by Cole et al. (1987, p. 788). To the south in eastern Kentucky, Hackley et al. (2021, this issue) concluded 30–50 mi of updip migration was necessary for emplacement of Upper Devonian Berea Sandstone oils based on geochemical arguments. This 30- 50-mi distance was based on the gap between areas of updip oil production and downdip locations of appropriate thermal maturity source rocks, using comparisons of source rock VRo to oil thermal maturity from sterane, hopane, and aromatic biomarker ratios in oil samples. In eastern Ohio, we lack spatially located geochemical data from oil samples to make similar arguments, but other similarities in the petroleum system (same source and reservoir rocks, same migration pathways, same regional structure) may suggest that oil migration in eastern Ohio is on the same order of magnitude (30–50 mi), rather than from a distant source. We note that samples Meleski Core 2962 2697–2698 ft and Winegardner 1-B 2400–2532 ft are near or have reached empirical sterane isomerization equilibrium yet are located significantly westward of the 0.5% VRo isoline of East et al. (2012). These sample locations are <25 mi from Berea Sandstone oil fields (Figure 1) and may constitute active source rocks.
SUMMARY AND CONCLUSIONS
In this investigation, we examined organic petrology and organic geochemistry of Devonian shale source rock samples from eastern Ohio and nearby areas to better understand organic matter sources, oil–source rock correlations, and thermal maturity in the Devonian petroleum system of the northern Appalachian Basin. In contrast to previous studies that suggested vitrinite was an important component, new data from petrographic examination and solvent extraction in this study show organic matter is dominated by amorphous organic matter (bituminite) and solid bitumen derived from marine algae, predominantly photosynthetic green algae and its bacterially derived degradation products and bacterial biomass. Thermal maturity predictions from BRo are lower than from other proxies (e.g., sterane isomerization ratios, which suggest middle to peak oil conditions). Moreover, Devonian shale source rocks are similar in composition to oils reservoired in Devonian strata based on multiple geochemical parameters and dissimilar in some respects to lower Paleozoic oils and source rocks that have higher gammacerane index values and pronounced odd-over-even n-alkane predominance (n-C13 to n-C21 range). These observations may suggest Devonian oils in eastern Ohio are sourced from nearby (<30–50 mi) Devonian shale source rocks rather than from a distant source “deep within the Appalachian Basin” as suggested by previous researchers (Cole et al., 1987, p. 788) and may impact future assessments of undiscovered hydrocarbon volumes and exploration in the Berea Sandstone. However, hopane and sterane isomerization ratios do not show consistent relationships to BRo and thermal proxies from programmed pyrolysis (Tmax), preventing development of empirical calibrations to relate these parameters in the Devonian of eastern Ohio.
REFERENCES CITED
Aquino Neto, F. R., J. M. Trendel, A. Restle, J. Connan, and P. A. Albrecht, 1983, Occurrence and formation of tricyclic and tetracyclic terpanes in sediments and petroleums, in Bjorøy, M. et al., eds., Advances in organic geochemistry 1981: Chichester, United Kingdom, John Wiley, p. 659–667.
Araujo, C. V., A. G. Borrego, B. Cardott, R. B. A. das Chagas, D. Flores, P. Gonçalves, and P. C. Hackley, et al., 2014a, Petrographic maturity parameters of a Devonian shale maturation series, Appalachian Basin, USA. ICCP Thermal Indices Working Group interlaboratory exercise: International Journal of Coal Geology, v. 130, p. 89–101, doi:10.1016/j.coal.2014.05.002.
ASTM International, 2015a, D2797: Standard practice for preparing coal samples for microscopical analysis by reflected light, petroleum products, lubricants, and fossil fuels; gaseous fuels; coal and coke: West Conshohocken, Pennsylvania, ASTM International, sec. 5, v. 05.06, 5 p.
ASTM International, 2015b, D7708: Standard test method for microscopical determination of the reflectance of vitrinite dispersed in sedimentary rocks, petroleum products, lubricants, and fossil fuels; gaseous fuels; coal and coke: West Conshohocken, Pennsylvania, ASTM International, sec. 5, v. 05.06, 10p.
Azevedo, D. A., F. R. Aquino Neto, B. R. T. Simoneit, and A. C. Pinto, 1992, Novel series of tricyclic aromatic terpanes characterized in Tasmanian tasmanite: Organic Geochemistry, v. 18, no. 1, p. 9–16, doi:10.1016/0146-6380(92)90138-N.
Baskin, D. K., 1997, Atomic H/C ratio of kerogen as an estimate of thermal maturity and organic matter conversion: AAPG Bulletin, v. 81, no. 9, p. 1437–1450.
Bernard, S., R. Wirth, A. Schreiber, H.-M. Schulz, and B. Horsfield, 2012, Formation of nanoporous pyrobitumen residues during maturation of the Barnett Shale (Fort Worth Basin): International Journal of Coal Geology, v. 103, p. 3–11, doi:10.1016/j.coal.2012.04.010.
Bishop, A. N., and G. D. Abbott, 1993, The interrelationship of biological marker maturity parameters and molecular yields during contact metamorphism: Geochimica et Cosmochimica Acta, v. 57, no. 15, p. 3661–3668, doi:10.1016/0016-7037(93)90147-O.
Blumer, M., R. R. L. Guillard, and T. Chase, 1971, Hydrocarbons of marine phytoplankton: Marine Biology, v. 8, no. 3, p. 183–189, doi:10.1007/BF00355214.
Bourbonniere, R. A., and P. A. Meyers, 1996, Sedimentary geolipid records of historical changes in the watersheds and productivities of Lakes Ontario and Erie: Limnology and Oceanography, v. 41, no. 2, p. 352–359, doi:10.4319/lo.1996.41.2.0352.
Bray, E. E., and E. D. Evans, 1961, Distribution of n-paraffins as a clue to recognition of source beds: Geochimica et Cosmochimica Acta, v. 22, no. 1, p. 2–15, doi:10.1016/0016-7037(61)90069-2.
Burton, Z. F. M., J. M. Moldowan, R. Sykes, and S. A. Graham, 2018, Unraveling petroleum degradation, maturity, and mixing and addressing impact on petroleum prospectivity: Insights from frontier exploration regions in New Zealand: Energy & Fuels, v. 32, no. 2, p. 1287–1296, doi:10.1021/acs.energyfuels.7b03261.
Carr, A. D., 2000, Suppression and retardation of vitrinite reflectance, part 1: Formation and significance for hydrocarbon generation: Journal of Petroleum Geology, v. 23, no. 3, p. 313–343, doi:10.1111/j.1747-5457.2000.tb01022.x.
Chandra, K., C. S. Mishra, U. Samanta, A. Gupta, and K. L. Mehrotra, 1994, Correlation of different maturity parameters in the Ahmedabad-Mehsana block of the Cambay basin: Organic Geochemistry, v. 21, no. 3–4, p. 313–321, doi:10.1016/0146-6380(94)90193-7.
Cole, G. A., R. J. Drozd, R. A. Sedivy, and H. I. Halpern, 1987, Organic geochemistry and oil-source correlations, Paleozoic of Ohio: AAPG Bulletin, v. 71, no. 7, p. 788–809.
Dembicki, H., 2009, Three common source rock evaluation errors made by geologists during prospect or play appraisals: AAPG Bulletin, v. 93, no. 3, p. 341–356, doi:10.1306/10230808076.
de Witt, W., Jr., J. B. Roen, and L. G. Wallace, 1993, Stratigraphy of Devonian black shales and associated rocks in the Appalachian Basin, in Roen, J. B., and R. C. Kepferle, eds., Petroleum geology of the Devonian and Mississippian Black Shale of eastern North America: Denver, Colorado, US Geological Survey Bulletin 1909, p. B1–B57.
Didyk, B. M., B. R. T. Simoneit, S. C. Brassell, and G. Eglinton, 1978, Organic geochemical indicators of palaeoenvironmental conditions of sedimentation: Nature, v. 272, no. 5650, p. 216–222, doi:10.1038/272216a0.
Dow, W. G., 1977, Kerogen studies and geological interpretations: Journal of Geochemical Exploration, v. 7, p. 79–99, doi:10.1016/0375-6742(77)90078-4.
Dutta, S., C. Hartkopf-Fröder, K. Witte, R. Brocke, and U. Mann, 2013, Molecular characterization of fossil palynomorphs by transmission micro-FTIR spectroscopy: Implications for hydrocarbon source evaluation: International Journal of Coal Geology, v. 115, p. 13–23, doi:10.1016/j.coal.2013.04.003.
East, J. A., C. S. Swezey, J. E. Repetski, and D. O. Hayba, 2012, Thermal maturity map of Devonian shale in the Illinois, Michigan, and Appalachian basins of North America: US Geological Survey Scientific Investigations Map 3214, scale 1:4,129,840, p. 3214.
Eble, C., P. C. Hackley, T. M. Parris, and S. F. Greb, 2021, Organic petrology and geochemistry of the Sunbury and Ohio Shales in eastern Kentucky: AAPG Bulletin, v. 105, no. 3, p. 493–515, doi:10.1306/09242019089.
Enomoto, C. B., M. H. Trippi, D. K. Higley, W. A. Rouse, F. T. Dulong, T. R. Klett, and T. J. Mercier, et al., 2018, Assessment of undiscovered continuous gas resources in Upper Devonian Shales of the Appalachian Basin Province, 2017: Fact sheet 2018-3018: US Geological Survey, 2 p., accessed October 5, 2020, https://pubs.er.usgs.gov/publication/fs20183018, doi:10.3133/fs20183018.
Espitalié, J., G. Deroo, and F. Marquis, 1985, La pyrolyse Rock-Eval et ses applications. Deuxième partie: Revue de l’Institut Français du Pétrole, v. 40, no. 6, p. 755–784, doi:10.2516/ogst:1985045.
Ettensohn, F. R., 2004, Modeling the nature and development of major Paleozoic clastic wedges in the Appalachian Basin, USA: Journal of Geodynamics, v. 37, no. 3–5, p. 657–681, doi:10.1016/j.jog.2004.02.009.
Fan, Z., and R. P. Philp, 1987, Laboratory biomarker fractionations and implications for migration studies: Organic Geochemistry, v. 11, no. 3, p. 169–175, doi:10.1016/0146-6380(87)90020-9.
GeoMark, 2015, Rock and fluid database, accessed October 5, 2020, http://geomarkresearch.com/database-products.
Grantham, P. J., 1986, Sterane isomerisation and moretane/hopane ratios in crude oils derived from Tertiary source rocks: Organic Geochemistry, v. 9, no. 6, p. 293–304, doi:10.1016/0146-6380(86)90110-5.
Grantham, P. J., and L. L. Wakefield, 1988, Variations in the sterane carbon number distributions of marine source rock derived crude oils through geological time: Organic Geochemistry, v. 12, no. 1, p. 61–73, doi:10.1016/0146-6380(88)90115-5.
Hackley, P. C., C. V. Araujo, A. G. Borrego, A. Bouzinos, B. Cardott, A. C. Cook, and C. Eble, et al, 2015, Standardization of reflectance measurements in dispersed organic matter: Results of an exercise to improve interlaboratory agreement: Marine and Petroleum Geology, v. 59, p. 22–34.
Hackley, P. C., and B. J. Cardott, 2016, Application of organic petrography in North American shale petroleum systems: A review: International Journal of Coal Geology, v. 163, p. 8–51, doi:10.1016/j.coal.2016.06.010.
Hackley, P. C., A. M. Jubb, R. C. Burruss, and A. E. Beaven, 2020, Fluorescence spectroscopy of ancient sedimentary organic matter via confocal laser scanning microscopy (CLSM): International Journal of Coal Geology, v. 223, p. 103445, doi:10.1016/j.coal.2020.103445.
Hackley, P. C., and J. Kus, 2015, Thermal maturity of Tasmanites microfossils from confocal laser scanning fluorescence microscopy: Fuel, v. 143, p. 343–350, doi:10.1016/j.fuel.2014.11.052.
Hackley, P. C., and M. D. Lewan, 2018, Understanding and distinguishing reflectance measurements of solid bitumen and vitrinite using hydrous pyrolysis: Implications to petroleum assessment: AAPG Bulletin, v. 102, no. 6, p. 1119–1140, doi:10.1306/08291717097.
Hackley, P. C., and N. K. Lünsdorf, 2018, Application of Raman spectroscopy as thermal maturity probe in shale petroleum systems: Insights from natural and artificial maturation sequences: Energy & Fuels, v. 32, no. 11, p. 11190–11202, doi:10.1021/acs.energyfuels.8b02171.
Hackley, P. C., T. M. Parris, C. F. Eble, S. F. Greb, and D. C. Harris, 2021, Oil–source correlation studies in the shallow Berea Sandstone petroleum system, eastern Kentucky: AAPG Bulletin, v. 105, no. 3, p. 517–542, doi:10.1306/08192019077.
Hackley, P. C., R. T. Ryder, M. H. Trippi, and H. Alimi, 2013, Thermal maturity of northern Appalachian Basin Devonian shales: Insights from sterane and terpane biomarkers: Fuel, v. 106, p. 455–462, doi:10.1016/j.fuel.2012.12.032.
Hackley, P. C., B. J. Valentine, and J. J. Hatcherian, 2018, On the petrographic distinction of bituminite from solid bitumen in immature to early mature source rocks: International Journal of Coal Geology, v. 196, p. 232–245, doi:10.1016/j.coal.2018.06.004.
Hackley, P. C., C. C. Walters, S. R. Kelemen, M. Mastalerz, and H. A. Lowers, 2017, Organic petrology and micro-spectroscopy of Tasmanites microfossils: Applications to kerogen transformations in the early oil window: Organic Geochemistry, v. 114, p. 23–44, doi:10.1016/j.orggeochem.2017.09.002.
Hart, B. S., and A. S. Steen, 2015, Programmed pyrolysis (Rock-Eval) data and shale paleoenvironmental analyses: A review: Interpretation, v. 3, no. 1, p. SH41–SH58, doi:10.1190/INT-2014-0168.1.
Higley, D. K., W. A. Rouse, C. B. Enomoto, M. H. Trippi, T. R. Klett, T. J. Mercier, and M. E. Brownfield, et al., 2016, Assessment of undiscovered oil and gas resources of the Mississippian Sunbury Shale and Devonian-Mississippian Chattanooga Shale in the Appalachian Basin Province, 2016: Fact sheet 2016-3085: Reston, Virginia, US Geological Survey, 2 p., accessed October 5, 2020, https://pubs.usgs.gov/fs/2016/3085/fs20163085.pdf.
Hill, R. J., D. M. Jarvie, J. A. Zumberge, M. Henry, and R. M. Pollastro, 2007, Oil and gas geochemistry and petroleum systems of the Fort Worth Basin: AAPG Bulletin, v. 91, no. 4, p. 445–473, doi:10.1306/11030606014.
Hosterman, J. W., and F. T. Dulong, 1989, A computer program for semi-quantitative mineral analysis by x-ray powder diffraction, in Pevear, D. R., and F. A. Mumpton, eds., Quantitative mineral analysis of clays: Chantilly, Virginia, Clay Minerals Society Workshop Lectures 1, p. 38–50.
Huang, W. Y., and W. G. Meinschein, 1979, Sterols as ecological indicators: Geochimica et Cosmochimica Acta, v. 43, no. 5, p. 739–745, doi:10.1016/0016-7037(79)90257-6.
Hunt, J. M., 1996, Petroleum geochemistry and geology: New York, W. H. Freeman and Company, 743 p.
Jacob, H., 1989, Classification, structure, genesis and practical importance of natural solid oil bitumen (“migrabitumen”): International Journal of Coal Geology, v. 11, no. 1, p. 65–79, doi:10.1016/0166-5162(89)90113-4.
Jiang, C., M. Li, K. G. Osadetz, L. R. Snowdon, M. Obermajer, and M. G. Fowler, 2001, Bakken/Madison petroleum systems in the Canadian Williston Basin. Part 2: Molecular markers diagnostic of Bakken and Lodgepole source rocks: Organic Geochemistry, v. 32, no. 9, p. 1037–1054, doi:10.1016/S0146-6380(01)00079-1.
Jiang, Z., R. P. Philp, and C. A. Lewis, 1988, Fractionation of biological markers in crude oils during migration and the effects on correlation and maturation parameters: Organic Geochemistry, v. 13, no. 1–3, p. 561–571, doi:10.1016/0146-6380(88)90076-9.
Johnson, C. L., T. J. Greene, D. A. Zinniker, J. M. Moldovan, M. S. Hendrix, and A. R. Carroll, 2003, Geochemical characteristics and correlation of oil and nonmarine source rocks from Mongolia: AAPG Bulletin, v. 87, no. 5, p. 817–846, doi:10.1306/12170201073.
Kepferle, R. C., 1993, A depositional model and basin analysis for gas-bearing black shale (Devonian and Mississippian) in the Appalachian Basin, in Roen, J. B., and R. C. Kepferle, eds., Petroleum geology of the Devonian and Mississippian Black Shale of eastern North America: Denver, Colorado, US Geological Survey Bulletin 1909, p. F1–F23.
Kohl, D., R. Slingerland, M. Arthur, R. Bracht, and T. Engelder, 2014, Sequence stratigraphy and depositional environments of the Shamokik (Union Springs) Member, Marcellus Formation, and associated strata in the middle Appalachian Basin: AAPG Bulletin, v. 98, no. 3, p. 483–513, doi:10.1306/08231312124.
Kroon, J., and J. W. Castle, 2011, Biomarkers in the Upper Devonian Huron Shale as indicators of biological source of organic matter, depositional environment, and thermal maturity: AAPG Search and Discovery article 20117, accessed October 5, 2020, http://www.searchanddiscovery.com/pdfz/documents/2011/20117kroon/ndx_kroon.pdf.html.
Kus, J., C. V. Araujo, A. G. Borrego, D. Flores, P. C. Hackley, M. Hámor-Vidó, and S. Kalaitzidis, et al., 2017, Identification of alginite and bituminite in rocks other than coal. 2006, 2009, and 2011 round robin exercises of the ICCP Identification of Dispersed Organic Matter Working Group: International Journal of Coal Geology, v. 178, p. 26–38, doi:10.1016/j.coal.2017.04.013.
Lewan, M. D., M. Bjorøy, and D. L. Dolcater, 1986, Effects of thermal maturation on steroid hydrocarbons as determined by hydrous pyrolysis of Phosphoria Retort Shale: Geochimica et Cosmochimica Acta, v. 50, no. 9, p. 1977–1987, doi:10.1016/0016-7037(86)90253-X.
Lupoi, J. S., L. P. Fritz, T. M. Parris, P. C. Hackley, L. Solotky, C. F. Eble, and S. Schlaegle, 2017, Assessment of thermal maturity trends in Devonian–Mississippian source rocks using Raman spectroscopy: Limitations of peak-fitting method: Frontiers in Energy Research, v. 5, 20 p.
Mackenzie, A. S., 1984, Application of biological markers in petroleum geochemistry, in Brooks, J., and D. H. Welte, eds., Advances in petroleum geochemistry: London, Academic Press, v. 1, p. 115–214, doi:10.1016/B978-0-12-032001-1.50008-0.
Mackenzie, A. S., S. C. Brassell, G. Eglinton, and J. R. Maxwell, 1982, Chemical fossils: The geological fate of steroids: Science, v. 217, no. 4559, p. 491–504, doi:10.1126/science.217.4559.491.
Mello, M. R., N. Telnaes, P. C. Gaglianone, M. I. Chicarelli, S. C. Brassell, and J. R. Maxwell, 1988, Organic geochemical characterization of depositional palaeoenvironments of source rocks and oils in Brazilian marginal basins: Organic Geochemistry, v. 13, no. 1–3, p. 31–45, doi:10.1016/0146-6380(88)90023-X.
Miceli Romero, A., and R. P. Philp, 2012, Organic geochemistry of the Woodford Shale, southeastern Oklahoma: How variable can shales be?: AAPG Bulletin, v. 96, no. 3, p. 493–517, doi:10.1306/08101110194.
Milici, R. C., and C. S. Swezey, 2006, Assessment of Appalachian Basin oil and gas resources: Devonian Shale—Middle and Upper Paleozoic total petroleum system: US Geological Survey Open-File Report 2006-1237, 70 p., accessed October 5, 2020, https://pubs.usgs.gov/of/2006/1237.
Mohialdeen, I. M. J., M. H. Hakimi, and F. M. Al-Beyati, 2013, Geochemical and petrographic characterization of Late Jurassic–Early Cretaceous Chia Gara Formation in northern Iraq: Palaeoenvironment and oil-generation potential: Marine and Petroleum Geology, v. 43, p. 166–177, doi:10.1016/j.marpetgeo.2013.02.010.
Moldowan, J. M., F. J. Fago, R. M. Carlson, D. C. Young, G. van Duyne, J. Clardy, M. Schoell, C. T. Pillinger, and D. S. Watt, 1991, Rearranged hopanes in sediments and petroleum: Geochimica et Cosmochimica Acta, v. 55, no. 11, p. 3333–3353, doi:10.1016/0016-7037(91)90492-N.
Moldowan, J. M., P. Sundararaman, and M. Schoell, 1986, Sensitivity of biomarker properties to depositional environment and/or source input in the Lower Toarcian of S.W. Germany: Organic Geochemistry, v. 10, no. 4–6, p. 915–926, doi:10.1016/S0146-6380(86)80029-8.
Ohio Division of Geological Survey, 1990, Generalized column of bedrock units in Ohio (revised): Columbus, Ohio, Ohio Department of Natural Resources, Division of Geological Survey, 1 p.
Ourisson, G., P. Albrecht, and M. Rohmer, 1982, Predictive microbial biochemistry: From molecular fossils to prokaryotic membranes: Trends in Biochemical Sciences, v. 7, no. 7, p. 236–239, doi:10.1016/0968-0004(82)90028-7.
Pang, X., M. Li, S. Li, and Z. Jin, 2003, Geochemistry of petroleum systems in the Niuzhuang South Slope of Bohai Bay Basin. Part 2: Evidence for significant contribution of mature source rocks to “immature oils” in the Bamianhe field: Organic Geochemistry, v. 34, no. 7, p. 931–950, doi:10.1016/S0146-6380(03)00032-9.
Parris, T. M., S. F. Greb, C. F. Eble, P. C. Hackley, and D. C. Harris, 2019, Berea sandstone petroleum system: Lexington, Kentucky, Kentucky Geological Survey Contract Report 6, Series XIII, 342 p., accessed October 5, 2020, https://kgs.uky.edu/kgsweb/olops/pub/kgs/CNR6_13.pdf.
Parris, T. M., P. C. Hackley, S. F. Greb, and C. F. Eble, 2021, Molecular and isotopic gas composition of the Devonian Berea Sandstone and implications for gas evolution, eastern Kentucky: AAPG Bulletin, v. 105, no. 3, p. 575–595, doi:10.1306/10142019103.
Passey, Q. R., K. M. Bohacs, W. L. Esch, R. Klimentidis, and S. Sinha, 2010, From oil-prone source rock to gas-producing shale reservoir: Geologic and petrophysical characterization of unconventional shale-gas reservoirs: Society of Petroleum Engineers International Oil and Gas Conference and Exhibition, Beijing, China, June 8–10, 2010, SPE-131350-MS, 29 p.
Peters, K. E., 1986, Guidelines for evaluating petroleum source rock using programmed pyrolysis: AAPG Bulletin, v. 70, no. 3, p. 318–329.
Peters, K. E., and M. R. Cassa, 1994, Applied source rock geochemistry, in Magoon, L. B., and W. G. Dow, eds., The petroleum system: From source to trap: AAPG Memoir 60, p. 93–120.
Peters, K. E., L. S. Ramos, J. E. Zumberge, Z. C. Valin, C. R. Scotese, and D. L. Gautier, 2007, Circum-Arctic petroleum systems identified using decision-tree chemometrics: AAPG Bulletin, v. 91, no. 6, p. 877–913, doi:10.1306/12290606097.
Peters, K. E., C. C. Walters, and J. M. Moldowan, 2005, The biomarker guide: Biomarkers and isotopes in petroleum exploration and earth history: Cambridge, United Kingdom, Cambridge University Press, v. 2, 704 p.
Peters, K. E., X. Xia, A. Pomerantz, and O. C. Mullins, 2016, Geochemistry applied to evaluation of unconventional resources, in Ma, Y. Z., and S. A. Holditch, eds., Unconventional oil and gas resources handbook: Evaluation and development: Waltham, Massachusetts, Elsevier, p. 71–126, doi:10.1016/B978-0-12-802238-2.00003-1.
Pickel, W., J. Kus, D. Flores, S. Kalaitzidis, K. Christanis, B. J. Cardott, and M. Misz-Kennan, et al., 2017, Classification of liptinite – ICCP System 1994: International Journal of Coal Geology, v. 169, p. 40–61, doi:10.1016/j.coal.2016.11.004.
Price, L. C., and C. E. Barker, 1985, Suppression of vitrinite reflectance in amorphous rich kerogen: A major unrecognized problem: Journal of Petroleum Geology, v. 8, no. 1, p. 59–84, doi:10.1111/j.1747-5457.1985.tb00191.x.
Repetski, J. E., R. T. Ryder, D. G. Weary, A. G. Harris, and M. H. Trippi, 2008, Thermal maturity patterns (CAI and %Ro) in Upper Ordovician and Upper Devonian rocks of the Appalachian Basin: A major revision of USGS Map I917-E using new subsurface collections: US Geological Survey Scientific Investigations Map 3006, accessed October 5, 2020, https://pubs.usgs.gov/sim/3006.
Riley, R. A., 2016, Mapping source rock and thermal maturity of the Devonian shale interval in eastern Ohio: Columbus, Ohio, Ohio Department of Natural Resources, Division of Geological Survey Open-File Report 2016-3, 22 p., accessed January 11, 2021, https://ohiodnr.gov/static/documents/geology/OFR2016_3_Riley_2016.pdf.
Riley, R. A., M. T. Baranoski, and L. H. Wickstrom, 2004, Oil and gas fields map of Ohio: Ohio Department of Natural Resources, Division of Geological Survey, scale 1:500,000.
Rimmer, S. M., D. J. Cantrell, and P. J. Gooding, 1993, Rock-Eval pyrolysis and vitrinite reflectance trends in the Cleveland Shale Member of the Ohio Shale, eastern Kentucky: Organic Geochemistry, v. 20, no. 6, p. 735–745, doi:10.1016/0146-6380(93)90058-J.
Rimmer, S. M., S. J. Hawkins, A. C. Scott, and W. L. Cressler, III, 2015, The rise of fire: Fossil charcoal in Late Devonian marine shales as an indicator of expanding terrestrial ecosystems, fire and atmospheric change: American Journal of Science, v. 315, no. 8, p. 713–733, doi:10.2475/08.2015.01.
Rimmer, S. M., J. A. Thompson, S. A. Goodnight, and T. L. Robl, 2004, Multiple controls on the preservation of organic matter in Devonian-Mississippian marine black shales: Geochemical and petrographic evidence: Palaeogeography, Palaeoclimatology, Palaeoecology, v. 215, no. 1–2, p. 125–154, doi:10.1016/S0031-0182(04)00466-3.
Robl, T. L., S. M. Rimmer, and L. S. Barron, 1992, Organic petrography of Mississippian and Devonian shales in east-central Kentucky: Fuel, v. 71, no. 3, p. 267–271, doi:10.1016/0016-2361(92)90072-V.
Robl, T. L., D. N. Taulbee, L. S. Barron, and W. C. Jones, 1987, Petrologic chemistry of a Devonian type II kerogen: Energy & Fuels, v. 1, no. 6, p. 507–513, doi:10.1021/ef00006a009.
Roen, J. B., 1984, Geology of the Devonian black shales in the Appalachian Basin: Organic Geochemistry, v. 5, no. 4, p. 241–254, doi:10.1016/0146-6380(84)90011-1.
Rullkötter, J., and R. Marzi, 1988, Natural and artificial maturation of biological markers in a Toarcian shale from northern Germany: Organic Geochemistry, v. 13, no. 4–6, p. 639–645, doi:10.1016/0146-6380(88)90084-8.
Ruppert, L. F., J. C. Hower, R. T. Ryder, J. R. Levine, M. H. Trippi, and W. C. Grady, 2010, Geologic controls on thermal maturity patterns in Pennsylvanian coal-bearing rocks in the Appalachian basin: International Journal of Coal Geology, v. 81, no. 3, p. 169–181, doi:10.1016/j.coal.2009.12.008.
Ryder, R. T., R. C. Burruss, and J. R. Hatch, 1998, Black shale source rocks and oil generation in the Cambrian and Ordovician of the central Appalachian Basin, USA: AAPG Bulletin, v. 82, no. 3, p. 412–441.
Ryder, R. T., P. C. Hackley, A. Hossein, and M. H. Trippi, 2013, Evaluation of thermal maturity in the low maturity Devonian shales of the northern Appalachian Basin: AAPG Search and Discovery article 10477, accessed October 5, 2020, http://www.searchanddiscovery.com/documents/2013/10477ryder/ndx_ryder.pdf.
Ryder, R. T., C. S. Swezey, R. D. Crangle, Jr., and M. H. Trippi, 2008, Geologic cross section E-E' through the Appalachian basin from the Findlay arch, Wood County, Ohio, to the Valley and Ridge province, Pendleton County, West Virginia: US Geological Survey Scientific Investigations Map 2985, 48 p., 2 sheets, doi:10.3133/sim2985.
Schwab, V., J. E. Spangenberg, and J. O. Grimalt, 2005, Chemical and carbon isotopic evolution of hydrocarbons during prograde metamorphism from 100°C to 550°C: Case study in the Liassic black shale formation of central Swiss Alps: Geochimica et Cosmochimica Acta, v. 69, no. 7, p. 1825–1840, doi:10.1016/j.gca.2004.09.011.
Seifert, W. K., and J. M. Moldowan, 1978, Applications of steranes, terpanes and monoaromatics to the maturation, migration and source of crude oils: Geochimica et Cosmochimica Acta, v. 42, no. 1, p. 77–95, doi:10.1016/0016-7037(78)90219-3.
Seifert, W. K., and J. M. Moldowan, 1986, Use of biomarkers in petroleum exploration, in Johns, R. B., ed., Methods in geochemistry and geophysics; Amsterdam, Elsevier, v. 24, p. 261–290.
Shanmugam, G., 1985, Significance of coniferous rain forests and related organic matter in generating commercial quantities of oil, Gippsland Basin, Australia: AAPG Bulletin, v. 69, p. 1241–1254.
Silverman, S. R., 1964, Investigations of petroleum origin and evolution mechanisms by carbon isotope studies, in Craig, H., S. L. Miller, and G. J. Wasserburg, eds., Isotopic and cosmic chemistry: Amsterdam, North Holland Publishing Co., p. 92–102.
Sinninghe Damsté, J., F. Kenig, M. E. Koopmans, J. Köster, S. Schouten, J. M. Hayes, and J. W. de Leeuw, 1995, Evidence for gammacerane as an indicator of water column stratification: Geochimica et Cosmochimica Acta, v. 59, no. 9, p. 1895–1900, doi:10.1016/0016-7037(95)00073-9.
Snowdon, L. R., 1995, Rock-Eval Tmax suppression: Documentation and amelioration: AAPG Bulletin, v. 79, no. 9, p. 1337–1348.
Soeder, D. J., 2018, The successful development of gas and oil resources from shales in North America: Journal of Petroleum Science Engineering, v. 163, p. 399–420, doi:10.1016/j.petrol.2017.12.084.
Sofer, Z., 1984, Stable carbon isotope compositions of crude oils: Application to source depositional environments and petroleum alteration: AAPG Bulletin, v. 68, no. 1, p. 31–49.
Strąpoć, D., M. Mastalerz, A. Schimmelmann, A. Drobniak, and N. R. Hassenmueller, 2010, Geochemical constraints on the origin and volume of gas in the New Albany Shale (Devonian-Mississippian), eastern Illinois Basin: AAPG Bulletin, v. 94, no. 11, p. 1713–1740, doi:10.1306/06301009197.
Taulbee, D. N., E. D. Seibert, L. S. Barron, and T. L. Robl, 1990, Comparison of maceral group chemistries for a New Albany and an Ohio oil shale kerogen: Energy & Fuels, v. 4, no. 3, p. 254–263, doi:10.1021/ef00021a007.
van Kaam-Peters, H. M. E., J. Köster, S. J. Van Der Gaast, M. Dekker, J. W. de Leeuw, and J. S. Dinninghe Damsté, 1998, The effect of clay minerals on diasterane/sterane ratios: Geochimica et Cosmochimica Acta, v. 62, no. 17, p. 2923–2929, doi:10.1016/S0016-7037(98)00191-4.
Volkman, J. K., 1986, A review of sterol markers for marine and terrigenous organic matter: Organic Geochemistry, v. 9, no. 2, p. 83–99, doi:10.1016/0146-6380(86)90089-6.
Wood, J. M., H. Sanei, M. E. Curtis, and C. R. Clarkson, 2015, Solid bitumen as a determinant of reservoir quality in an unconventional tight gas siltstone play: International Journal of Coal Geology, v. 150–151, p. 287–295, doi:10.1016/j.coal.2015.03.015.
Yang, S., H.-M. Schulz, N. H. Schovsbo, and J. A. Bojesen-Koefoed, 2017, Oil–source-rock correlation of the Lower Paleozoic petroleum system in the Baltic Basin (northern Europe): AAPG Bulletin, v. 101, no. 12, p. 1971–1993, doi:10.1306/02071716194.
Zhang, S., and H. Huang, 2005, Geochemistry of Palaeozoic marine petroleum from the Tarim Basin, NW China: Part 1. Oil family classification: Organic Geochemistry, v. 36, no. 8, p. 1204–1214, doi:10.1016/j.orggeochem.2005.01.013.
AUTHORS
Paul C. Hackley is a research geologist at USGS in Reston, Virginia, where he oversees the Organic Petrology Laboratory. He holds degrees from Shippensburg University (B.A.), George Washington University (M.Sc.), and George Mason University (Ph.D.). His primary research interests are in organic petrology and its application to fossil fuel assessment.
Robert T. Ryder is a retired research geologist with the USGS (Denver, Reston). He retired in 2011 after 38 years. Previously, he worked for Shell Oil Company. Ryder holds degrees from Michigan State University (B.S.) and Pennsylvania State University (Ph.D.). He has studied the geologic framework and petroleum systems of many United States (Rocky Mountains, Appalachian) and Chinese basins.
ACKNOWLEDGMENTS
Reviews by Paul Lillis (USGS), an anonymous journal reviewer, guest editor T. Marty Parris, AAPG Editor Robert K. Merrill, and past AAPG Editor Barry Katz improved this paper. Staff of GeoMark Research, Ltd., are thanked for access to and the use of their proprietary geochemical database, without which this study would not be possible. Vicky Rocha (Weatherford Laboratories) coordinated geochemical analyses and helped with technical questions on methods. Augusta Warden, Zachary Lowry, Tammy Hannah, and Mark Dreier (USGS-Lakewood) provided geochemical analyses and helped with technical questions on methods. Justin Birdwell (USGS-Lakewood) also provided information related to USGS organic geochemistry laboratory methods. Frank Dulong (USGS-Reston) provided x-ray diffraction analyses. Mike Trippi (USGS) assisted in the creation of Figure 1. This research was funded by the USGS Energy Resources Program. All USGS-generated data associated with this research are in figures and tables included herein and can be accessed from https://doi.org/10.5066/P90AGOY5. Any use of trade, firm, or product names is for descriptive purposes only and does not imply endorsement by the US Government.