The AAPG/Datapages Combined Publications Database
AAPG Bulletin
Figure
AAPG Bulletin; Year: 2021; Issue: March DOI: 10.1306/08192019076
Return to Full Text
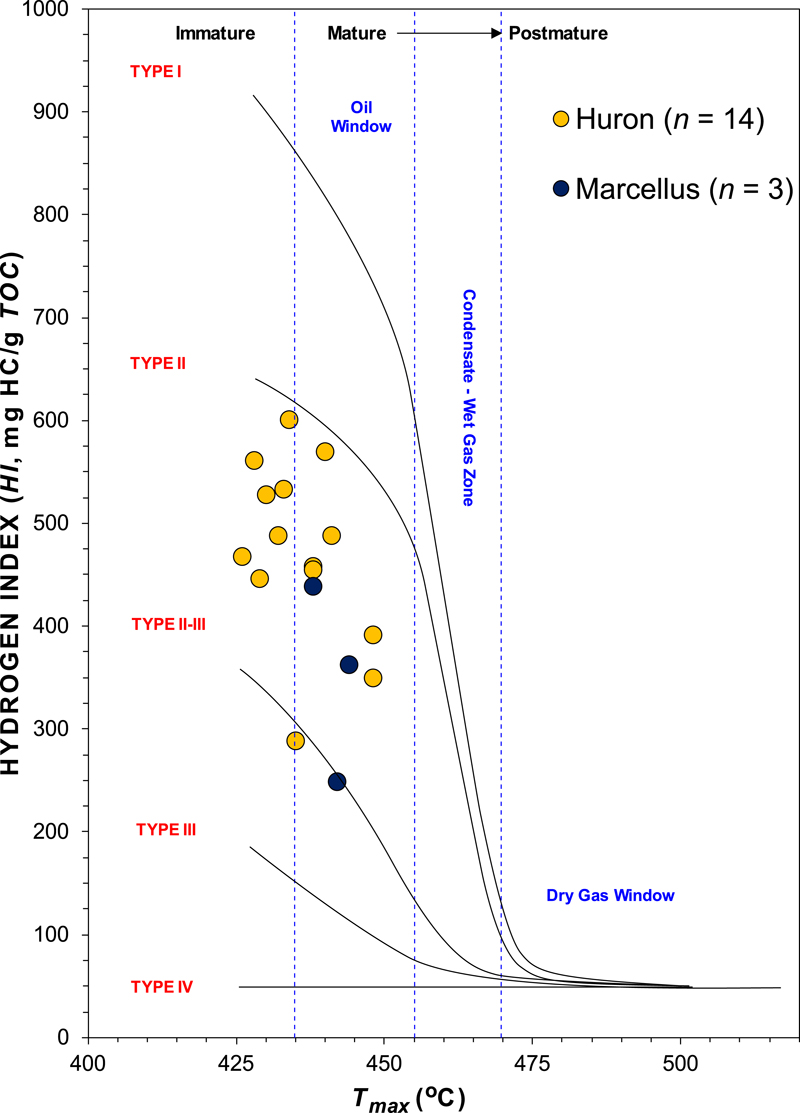
Figure 5. Plot of hydrogen index (HI, S2×100/total organic carbon [TOC] in milligrams of hydrocarbons per gram TOC) versus the temperature at the S2 peak of programmed pyrolysis (Tmax) (°C) showing evolution of kerogen composition with thermal maturity. Maturation boundaries are based on Peters and Cassa (1994) and Baskin (1997). The kerogen type evolution lines are based on Espitalié et al. (1985) and Hart and Steen (2015).
Figure 5. Plot of hydrogen index (HI, S2×100/total organic carbon [TOC] in milligrams of hydrocarbons per gram TOC) versus the temperature at the S2 peak of programmed pyrolysis (Tmax) (°C) showing evolution of kerogen composition with thermal maturity. Maturation boundaries are based on Peters and Cassa (1994) and Baskin (1997). The kerogen type evolution lines are based on Espitalié et al. (1985) and Hart and Steen (2015).