The AAPG/Datapages Combined Publications Database
AAPG Bulletin
Full Text
![]() Click to view page images in PDF format.
Click to view page images in PDF format.
AAPG Bulletin, V.
DOI: 10.1306/08192019077
Oil–source correlation studies in the shallow Berea Sandstone petroleum system, eastern Kentucky
Paul C. Hackley,1 Thomas M. (Marty) Parris,2 Cortland F. Eble,3 Stephen F. Greb,4 and David C. Harris5
1US Geological Survey (USGS), Reston, Virginia; [email protected]
2Kentucky Geological Survey (KGS), University of Kentucky, Lexington, Kentucky; [email protected]
3KGS, University of Kentucky, Lexington, Kentucky; [email protected]
4KGS, University of Kentucky, Lexington, Kentucky; [email protected]
5KGS, University of Kentucky, Lexington, Kentucky; [email protected]
ABSTRACT
Shallow production of sweet high-gravity oil from the Upper Devonian Berea Sandstone in northeastern Kentucky has caused the region to become the leading oil producer in the state. Potential nearby source rocks, namely, the overlying Mississippian Sunbury Shale and underlying Ohio Shale, are immature for commercial oil generation according to vitrinite reflectance and programmed pyrolysis analyses. We used organic geochemical measurements from Berea oils and solvent extracts from potential Upper Devonian–Mississippian source rocks to better understand organic matter sources, oil–oil and oil–source rock correlations, and thermal maturity in the shallow Berea oil play. Multiple geochemical proxies suggest Berea oils are from one family and from similar source rocks. Oils and organic matter in the potential source rocks are from a marine source based on pristane-to-phytane (Pr/Ph) and terrestrial-to-aquatic ratios, carbon preference index values, n-alkane maxima, C-isotopic composition, and tricyclic terpane and hopane ratios. Any or all of the Devonian to Mississippian black shale source rocks could be potential source rocks for Berea oils based on similarities in oil and solvent extract Pr/n-C17 and Ph/n-C18 ratios, sterane distributions, C-isotopic values, and sterane/hopane and tricyclic terpane ratios. Multiple biomarker ratios suggest Berea oils formed at thermal maturities of approximately 0.7% –0.9% vitrinite reflectance. These data require significant updip lateral migration of 30–50 mi from a downdip Devonian black shale source kitchen to emplace low-sulfur oils in the shallow updip oil-play area and indicate that immature source rocks nearby to Berea oil production are not contributing to produced hydrocarbons.
INTRODUCTION
Hydrocarbons have been produced from the Upper Devonian Berea Sandstone of northeastern Kentucky since the late 1870s (Nuttall, 2016). In the early 2010s, the completion of shallow horizontal oil wells with slickwater hydraulic fracturing in Greenup and Lawrence Counties began a renaissance of the Berea play and caused northeastern Kentucky to become the state’s leading oil-producing region (Parris and Nuttall, 2021, this issue). Shallow drilling depths (less than ∼2200 ft vertical depth) and production rates of hundreds to thousands of barrels of oil per month provided strong incentives for further development of the Berea oil play and prompted this oil–source rock correlation study in the context of a broader investigation of the Berea petroleum system (Parris et al., 2019; other papers in this issue).
The Berea Sandstone is the uppermost Devonian (Molyneux et al., 1984) formation of eastern Kentucky and lies between Upper Devonian Ohio Shale and Lower Mississippian Sunbury Shale source rocks (Figure 1). It is present from northeastern Ohio and western West Virginia to eastcentral Kentucky (Pashin and Ettensohn, 1987) and generally grades southwestward to siltstone (Pashin and Ettensohn, 1992, and references therein), causing its 1980s subsurface designation as a “tight formation” (Nuttall, 2016). The Berea also is complexly interbedded with shale (Bedford Shale) and the Berea–Bedford interval commonly was mapped as one unit on bedrock geologic maps (e.g., McDowell, 1986). Underlying the Berea, the Ohio Shale is divided into black, organic-rich (lower Huron, upper Huron, and Cleveland) and still black but less organic-rich (middle Huron, Three Lick Bed) shales. These black shales traditionally have been interpreted as representative of distal siliciclastic deposition in deep anoxic waters of the ancestral Appalachian Basin (Kepferle, 1993, and references therein), although some scientists have challenged the notion of deep-water deposition (Alshahrani and Evans, 2014). The Berea is overlain by organic-rich Sunbury Shale, also interpreted to have been deposited in conditions similar to the Ohio Shale (Ettensohn, 1985).
 Figure 1. Upper Devonian and Lower Mississippian stratigraphic units in the central Appalachian Basin with Berea Sandstone shaded yellow. Fm = Formation; Gp = Group; Int. = international; Mbr = Member; Sh = Shale; Ss = Sandstone. Modified from Parris et al. (2019) with permission of Kentucky Geological Survey.
In eastern Kentucky, the Berea Sandstone was deposited in the Catskill clastic wedge as a response to the Appalachian orogeny on the eastern margin of the Appalachian foreland basin (Tankard, 1986; Ettensohn et al., 1988; Ettensohn, 2004). From outcrop in northeastern Kentucky and central Ohio, the Berea Sandstone and adjacent Ohio and Sunbury Shale source rocks dip gently southeastward into the subsurface of the Appalachian Basin. Thermal maturity increases southeastward with increasing burial depth from the outcrop belt into the subsurface (Rimmer et al., 1993; Repetski et al., 2008; East et al., 2012). These investigations have suggested most of the Devonian section of northeastern Kentucky is immature for hydrocarbon generation given the conventionally accepted entrance to the economic oil window at approximately 0.6% vitrinite reflectance (VRo). Repetski et al. (2008) and East et al. (2012) showed southwest–northeast trending VRo isolines in northeastern Kentucky, with most of the area at VRo values <0.6%. In southeastern Kentucky, a small area of oil window to wet gas thermal maturity is present at VRo values of 0.6%–1.3%, and a very small area in southeasternmost Pike County is at the wet gas to dry gas transition according to VRo values >1.3%. Similar to VRo, thermal proxies from programmed pyrolysis also predict that local source rocks are immature for hydrocarbon generation (Eble et al., 2021, this issue). However, a large area of Devonian hydrocarbon production occurs where Devonian source rocks are immature, according to published VRo and programmed pyrolysis data, requiring (1) updip lateral migration from a thermally mature source kitchen; (2) vertical migration from an underlying, thermally mature source rock; or (3) a reevaluation of the conventional 0.6% VRo entrance to the oil window for Devonian source rocks in northeastern Kentucky. To the north of our study area in Ohio, previous scientists suggested updip lateral migration from a source “deep within the Appalachian Basin” was responsible for the emplacement of oil in upper Paleozoic reservoirs (Cole et al., 1987, p. 788), an idea revisited herein.
The objective of this paper, therefore, was to evaluate the shallow Berea oils from northeastern Kentucky in a petroleum system context, using geochemical data from produced oils and solvent extracts from nearby potential source rocks. In particular, we investigated the sources of organic matter and oil–oil and oil–source rock correlations to examine if oils were generated from nearby source rocks, which appear immature for oil generation based on the typically accepted entrance to the oil window at approximately 0.6% VRo (Dow, 1977; Dembicki, 2009), vertically migrated from underlying source rocks or were laterally migrated from a deeper source kitchen.
METHODS
Sample Materials and Selection
Sample materials are listed in Table 1. Samples were selected based on results from related thermal maturity analyses including vitrinite and solid bitumen reflectance, total organic carbon content, and programmed pyrolysis analysis (Eble et al., 2021, this issue), along with consideration of their stratigraphic (Figure 1) and geographic location (Figure 2; see Parris et al., 2021, this issue, for well coordinates). Twenty-three rock samples were selected from seven wells for geochemical characterization (by GeoMark Research, Ltd.) using gravimetric column chromatography, gas chromatography–flame ionization detection (GC-FID), gas chromatography–mass spectrometry (GC-MS), and isotope ratio–mass spectrometry (IR-MS) measurements. Efforts were made to collect uncontaminated rock with clean surfaces; however, no special attempt was used to separate the outer surfaces of core samples (e.g., French et al., 2015). Cores were from legacy drilling programs and unlikely to be contaminated from oil-based drilling muds because of evaporation from lengthy storage. Solvent extracts were obtained from the nearby stratigraphic units considered to be potential source rocks for Berea oils, including the Sunbury (n = 5), Cleveland (n = 4), upper Huron (n = 5), and lower Huron (n = 6). Solvent extracts also were obtained from reservoir solid bitumen filling intergranular porosity in the Berea Sandstone (n = 1) and from black Bedford shale (n = 2) in the downdip EQT 504353 well. These latter samples were not considered potential source rocks for Berea oils but were sampled and analyzed for a related study (Parris et al., 2021, this issue), which examined sources of natural gas produced from the Berea Sandstone. The solvent extracts span the thermal maturity range from immature (VRo < 0.6%) to wet gas mature (VRo = 1.1%–1.4%).
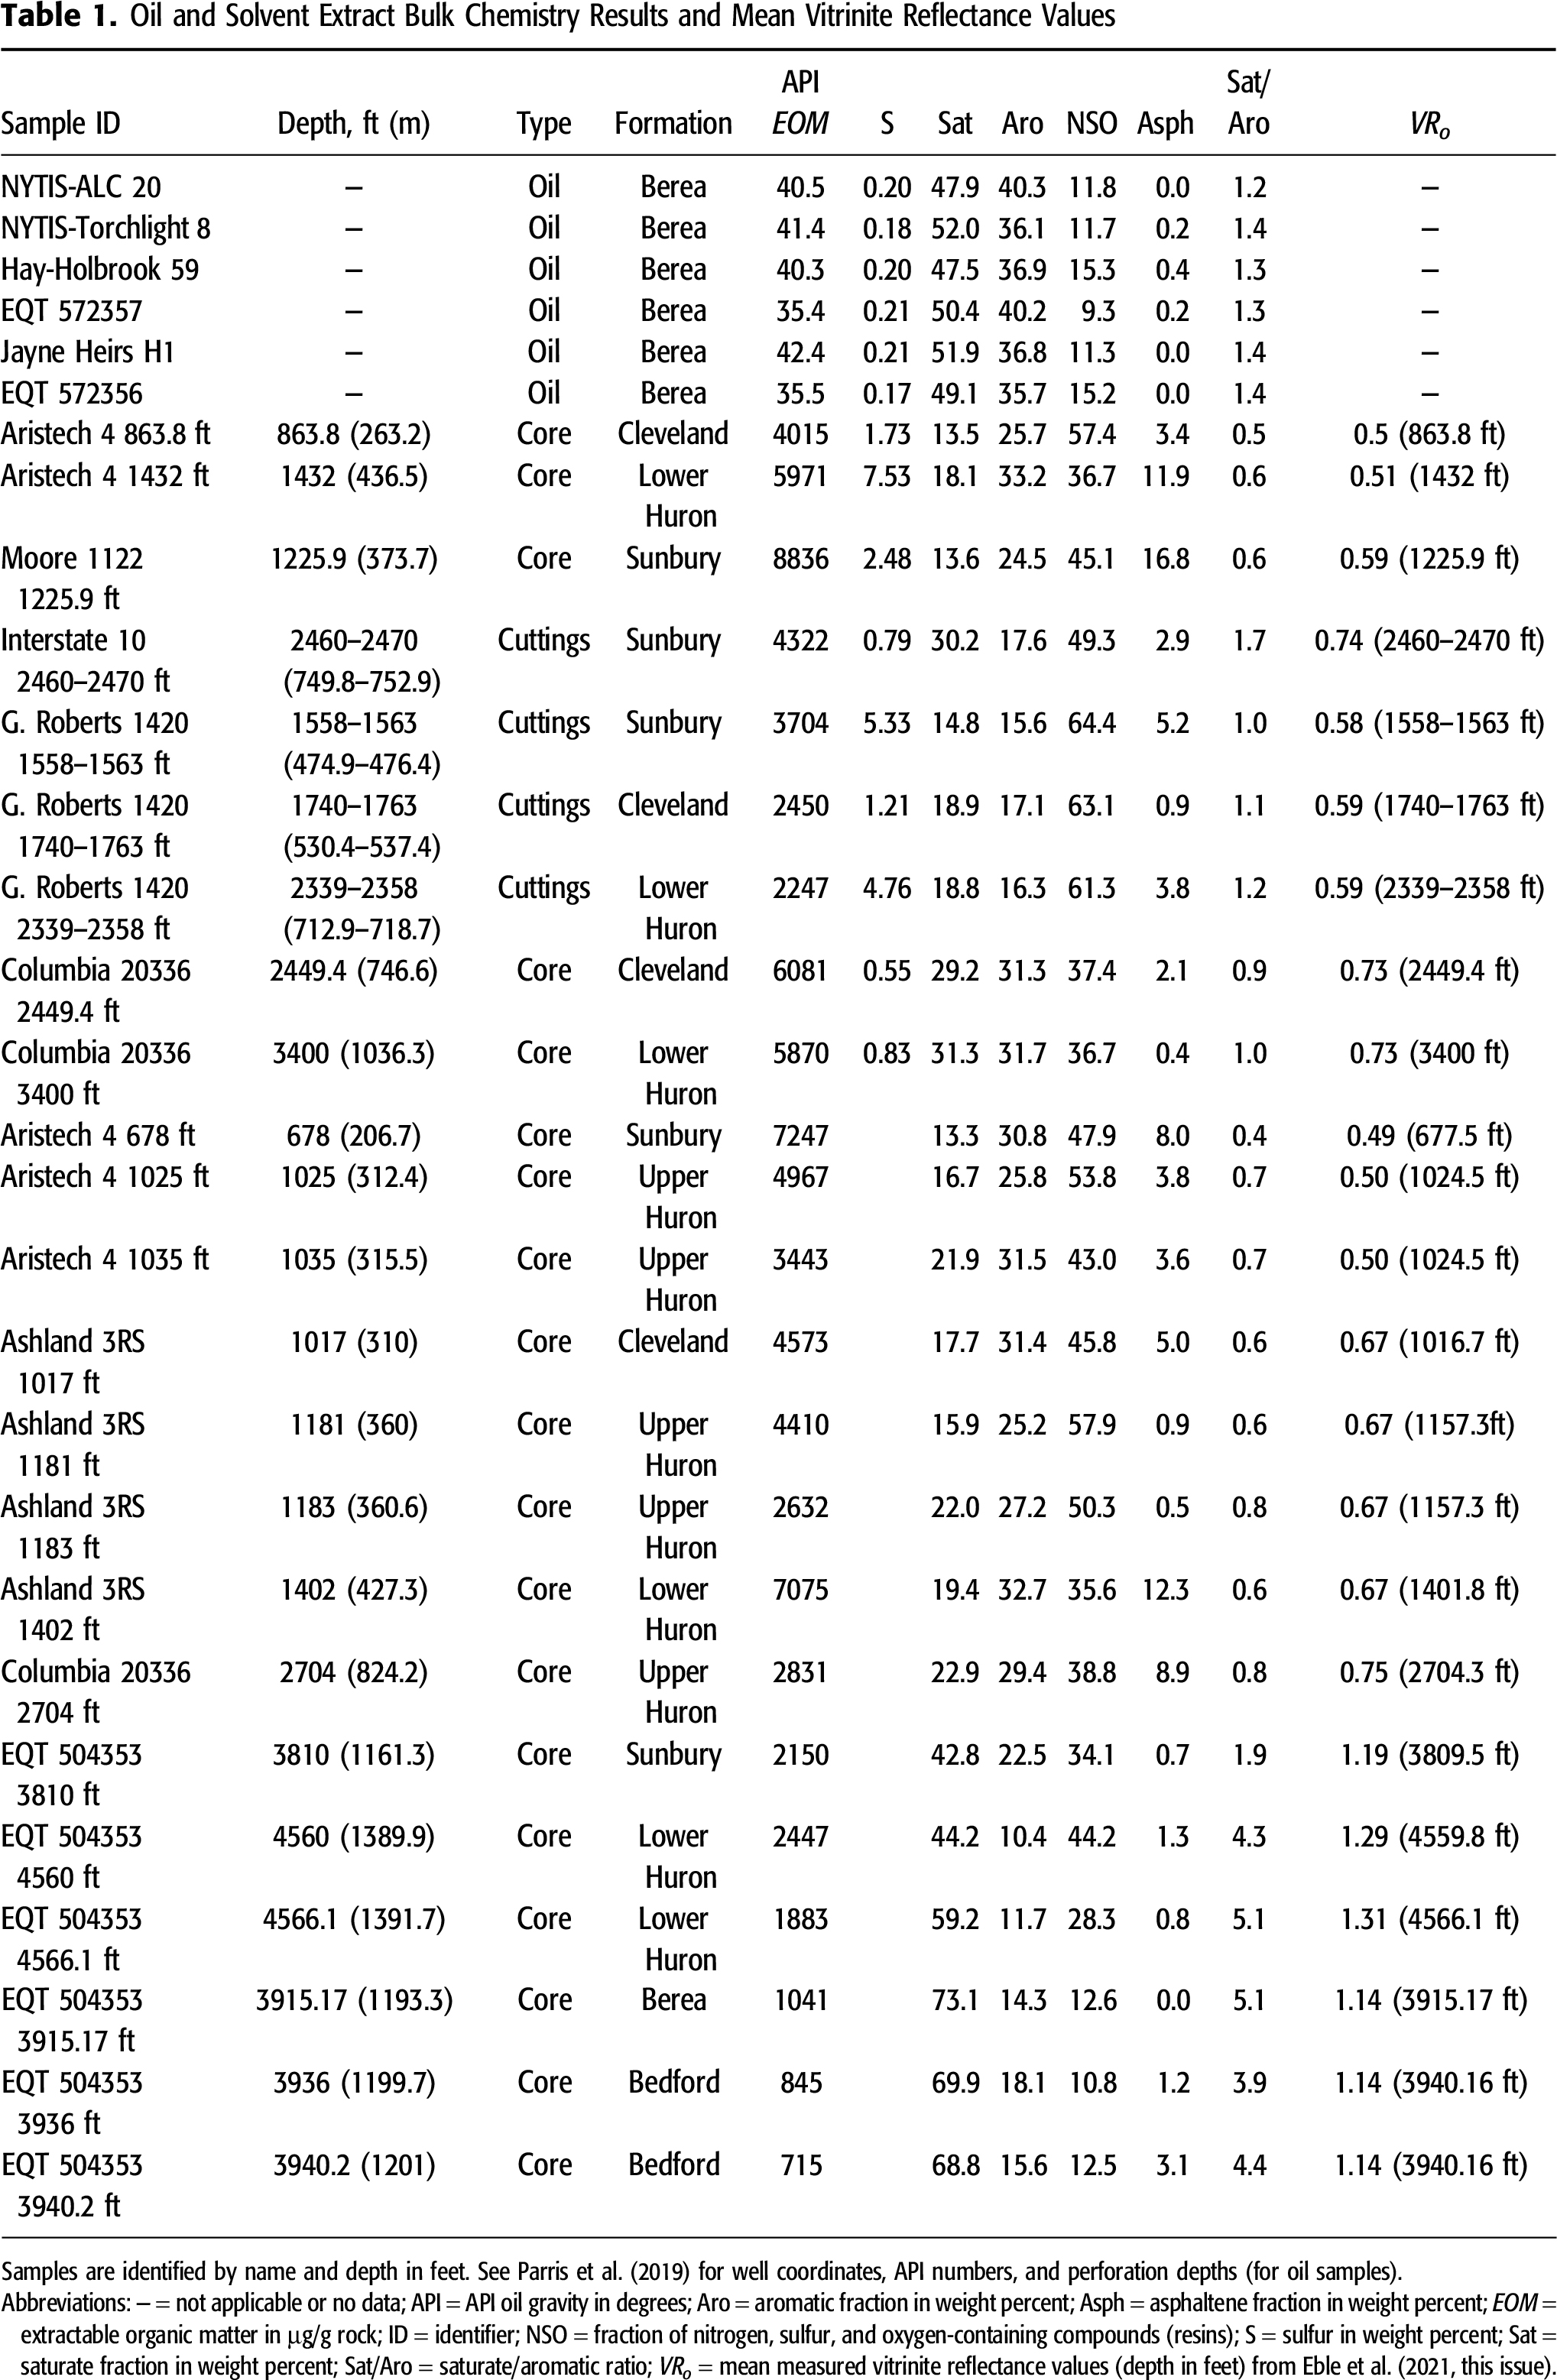
 Figure 2. Location of solvent extract and oil samples. The 0.6% and 1.3% vitrinite reflectance (VRo) isolines are from East et al. (2012). Kentucky and Ohio counties in tan and gray, respectively. Gray in the index map shows the extent of the Appalachian Basin. Modified from Parris et al. (2019) with permission of Kentucky Geological Survey.
A similar suite of geochemical measurements was conducted on Berea-reservoired oil samples collected from six wells in Greenup, Lawrence, Johnson, and Martin Counties. Oil samples were collected at the wellhead in glass vials with Teflon liners during active pumping, with the exception of the EQT 572357 sample, which was collected at the tank battery. All wells produce oil only from the Berea Sandstone over a shallow depth range of 260 to 1191 ft subsea.
Geochemical Analyses
For all solvent extractions, approximately 10 g of rock sample powdered via mortar and pestle was weighed into precleaned 22 ml stainless steel (SS) cells and sealed with SS caps. Cells were loaded into a Dionex ASE 350 accelerated solvent extractor and filled with 40 ml of dichloromethane (DCM), heated at 100°C and pressurized to 1400 psi (9650 kPa) for 5 min. Solvent was then flushed into a collection vial, and the process was repeated twice. Extracts were air dried at room temperature and weighed after solvent evaporation to quantify extractable organic matter.
The API gravity on oil samples was measured by injecting 1–2 ml into an Anton Paar DMA 500 density meter as per ASTM D287 (ASTM International, 2012). The API measurements were done in triplicate. Weight percent sulfur of whole extract and oils was measured using the vario ISOTOPE select elemental analyzer via the Dumas combustion process. Elemental sulfur removal was not necessary because sharp peaks were obtained in the C20 region in mass-to-charge ratio (m/z) 191 fragmentograms. The <C15 fraction of oils was determined by weighing a 100-mg aliquot, topping by evaporation in nitrogen for 30 min, and reweighing. Asphaltenes were precipitated from C15+ whole extracts and oils using n-hexane overnight at room temperature, followed by centrifugation for 15 min. The C15+ deasphalted aliquot was separated into fractions of saturate; aromatic; and nitrogen, sulfur, and oxygen organic compounds (NSO) using gravity flow column chromatography with a 100–200-mesh (150–75-μm) silica gel support previously activated at 400°C. Saturate, aromatic, and NSO fractions were eluted using hexane, methylene chloride, and methylene chloride/methanol (50:50), respectively, using 50 ml of solvent in a 250-ml column. Fractions were dried and weighed gravimetrically.
Isoprenoid and n-alkane compositions of whole extracts and oils were determined using an Agilent 7890A GC-FID. Samples were injected (split mode 75/1; 350°C) on a 30 m × 0.32 mm J&W DB-5 column (0.25 μm film thickness), and temperature was programmed from −60°C to 350°C at 12°C/min. Helium was used as carrier gas at a flow rate of 2 ml/min.
Stable carbon isotope compositions (13C/12C) of whole oil/solvent extract and C15+ saturate and aromatic hydrocarbon fractions were measured in duplicate (saturate and aromatic fractions; whole oil/solvent extract run as singles) with an Isoprime vario ISOTOPE select elemental analyzer and a VisION isotope ratio mass spectrometer. Results are reported on a per mil basis relative to the Vienna Peedee belemnite standard. Precision specifications are ±0.1‰ for saturate and aromatic fractions.
The GC-MS analyses of the C15+ saturate and aromatic hydrocarbon fractions (sample volumes in the range 50–250 μl, using 0.5–2.0 mg for each fraction diluted with DCM) were used to determine biomarker distributions and abundances. Measurements were done with an Agilent 7890A or 7890B gas chromatograph interfaced to a 5975C or 5977A mass spectrometer run in selected ion mode for m/z 177, 191, 205, 217, 218, 221, 231, and 259 for saturates (dwell time 100 ms) and 33, 156, 170, 178, 184, 188, 192, 198, 231, 239, 245, and 253 for aromatics (dwell time 80 ms). Samples were injected at 330°C on a 50 m × 0.2 mm J&W HP-5 column (0.11 μm film thickness), and the temperature was programmed from 150°C to 325°C at 2°C/min for the saturate fraction and 100°C to 325°C at 3°C/min for the aromatic fraction. Helium was used as carrier gas at a constant flow rate of 0.5 ml/min. Semiquantitative measurement of absolute concentrations of individual biomarkers was done by adding 50 μl of deuterated internal standard (d4-C29 20R ethylcholestane, 10 μg/g) to the C15+ saturate fraction and 10 μl of deuterated anthracene standard (d10, 10 μg/g) to the aromatic fraction.
The VRo measurements were determined on rock samples following ASTM D7708 (ASTM International, 2015) as reported in Eble et al. (2021, this issue).
RESULTS
Oil and Solvent Extract Bulk Chemistry
Results from all geochemical analyses are listed in Parris et al. (2019), and select results for oil and extract bulk chemistry are compiled in Table 1. Overall, oil sample API gravity values (n = 6) range from 35.4° to 42.4° (light crude) but occur in two sets with narrow ranges of 35.4° to 35.5° (n = 2) and 40.3° to 42.4° (n = 4). The two lower values of 35.4° and 35.5° are in the more downdip, higher-maturity areas of Martin and Johnson County, respectively, and one was collected from the lease stock tank where loss of volatiles may have impacted the gravity measurement. No relationship was observed between API gravity values and sulfur concentrations. Oil sulfur contents (n = 6) are uniformly low, ranging from 0.17 to 0.21 wt. % (light sweet crude). Sulfur contents from solvent extracts (n = 9) are significantly higher, ranging from 0.50 to 7.53 wt. %. The highest extract sulfur content occurs in the lower Huron sample from the low-maturity Aristech well.
Column Chromatography
Fractionation results from gravimetric column chromatography of oil samples show a dominant saturate component ranging from 47.9 to 52.0 wt. %, followed by aromatics ranging from 35.7 to 40.3 wt. %, and resins plus asphaltenes ranging from 9.5 to 15.7 wt. %. Saturate/aromatic ratios range from 1.2 to 1.4. Oil C15+ saturates, aromatic, resins, and asphaltenes (SARA) values are tightly clustered in the bulk composition ternary plot (Figure 3), whereas solvent extract samples show a much broader range of values with a higher component of resins plus asphaltenes. Upper Huron solvent extract values (n = 5) show the most uniform distribution, although these samples range from immature (VRo = 0.50%) to early oil window (VRo = 0.75%). The lower Huron extract samples show the greatest range in composition; Ohio Shale and Sunbury extracts from the most downdip high-maturity EQT 504353 well location in Pike County contain high saturate proportions at 42.8%–59.2%, similar to Berea oil samples. The Berea Sandstone and Bedford solvent extracts from the same location contain the highest saturate proportions observed in this study at 68.8%–73.1%.
 Figure 3. Oil and solvent extract C15+ SARA (saturates, aromatic, resins, and asphaltenes) results from gravimetric column chromatography. Modified from Parris et al. (2019). Arom = aromatic; avg. = average; NSO+Asph = nitrogen, sulfur, and oxygen-containing compounds (resins) plus asphaltenes; Sat = saturate.
Gas Chromatography
Chromatograms of oil samples reveal similar n-alkane envelopes and acyclic isoprenoid concentrations, with minor exceptions. Distributions of n-alkanes are unimodal, with maxima toward the low carbon numbers (n-alkanes <C15 equals 42.4–51.2 wt. %; Table 2) and a steady decrease in peak height with increasing carbon number (Figure S1, supplementary material available as AAPG Datashare 128 at www.aapg.org/datashare). Peak height maxima are at n-C5, except for the previously mentioned wells with lower API gravity values in which loss of light ends is apparent and maxima are at n-C8. High carbon preference index (CPI) values in samples from Torchlight 8 and Jayne Heirs H1, which both have carbon CPI values of 1.49 (Table 2), may be indicative of possible contamination from high molecular weight phthalate plasticizers, which shows up near elution of C27 (Figure S1, supplementary material available as AAPG Datashare 128 at www.aapg.org/datashare). Chromatograms from solvent extracts are more variable than crude oils but generally unimodal, with maxima at n-C15–17 (Figure S2, supplementary material available as AAPG Datashare 128 at www.aapg.org/datashare). Solvent extract from Berea Sandstone sample EQT 504353 3915.17 ft with reservoir-filling solid bitumen shows a maximum closer to n-C25. Solvent extract chromatograms also show possible contamination from high molecular weight phthalate plasticizers as indicated by the unlabeled peaks in Figure S2 (supplementary material available as AAPG Datashare 128 at www.aapg.org/datashare). A slight secondary maximum may be present over an unresolved complex mixture (UCM) at n-C29–31. Pristane-to-phytane ratios (Pr/Ph) for oil and solvent extracts generally range from 1.4 to 3.1, with several higher outlying values >4.7 from solvent extracts (Table 2). The outlier Pr/Ph values are from solvent extracts from the high-maturity EQT 504353 well in Pike County at the southernmost end of the study area. Oil samples show uniform Pr/Ph with all six samples ranging from 1.97 to 2.13. Isoprenoid to normal alkane ratios Pr/n-C17 and Ph/n-C18 for oil and solvent extract samples plot in the mixed terrigenous–marine organic matter area of the discrimination diagram (Figure 4; Shanmugam, 1985; Hunt, 1996). Solvent extracts show greater variability but generally plot closely to Berea oil samples. Crude oil and solvent extract samples exhibit little to no evidence of biodegradation as confirmed through absence of UCM, low Pr/n-C17 and Ph/n-C18 ratios, and the consistency of n-alkane envelopes. High Pr/n-C17 ratios in three samples from the high-maturity EQT 504353 well are suspect and may be impacted by analytical difficulties associated to the higher maturity (lower signal to noise) or possible coelution of contaminant phases, as indicated by unresolved minor peaks near n-C17 and n-C18.
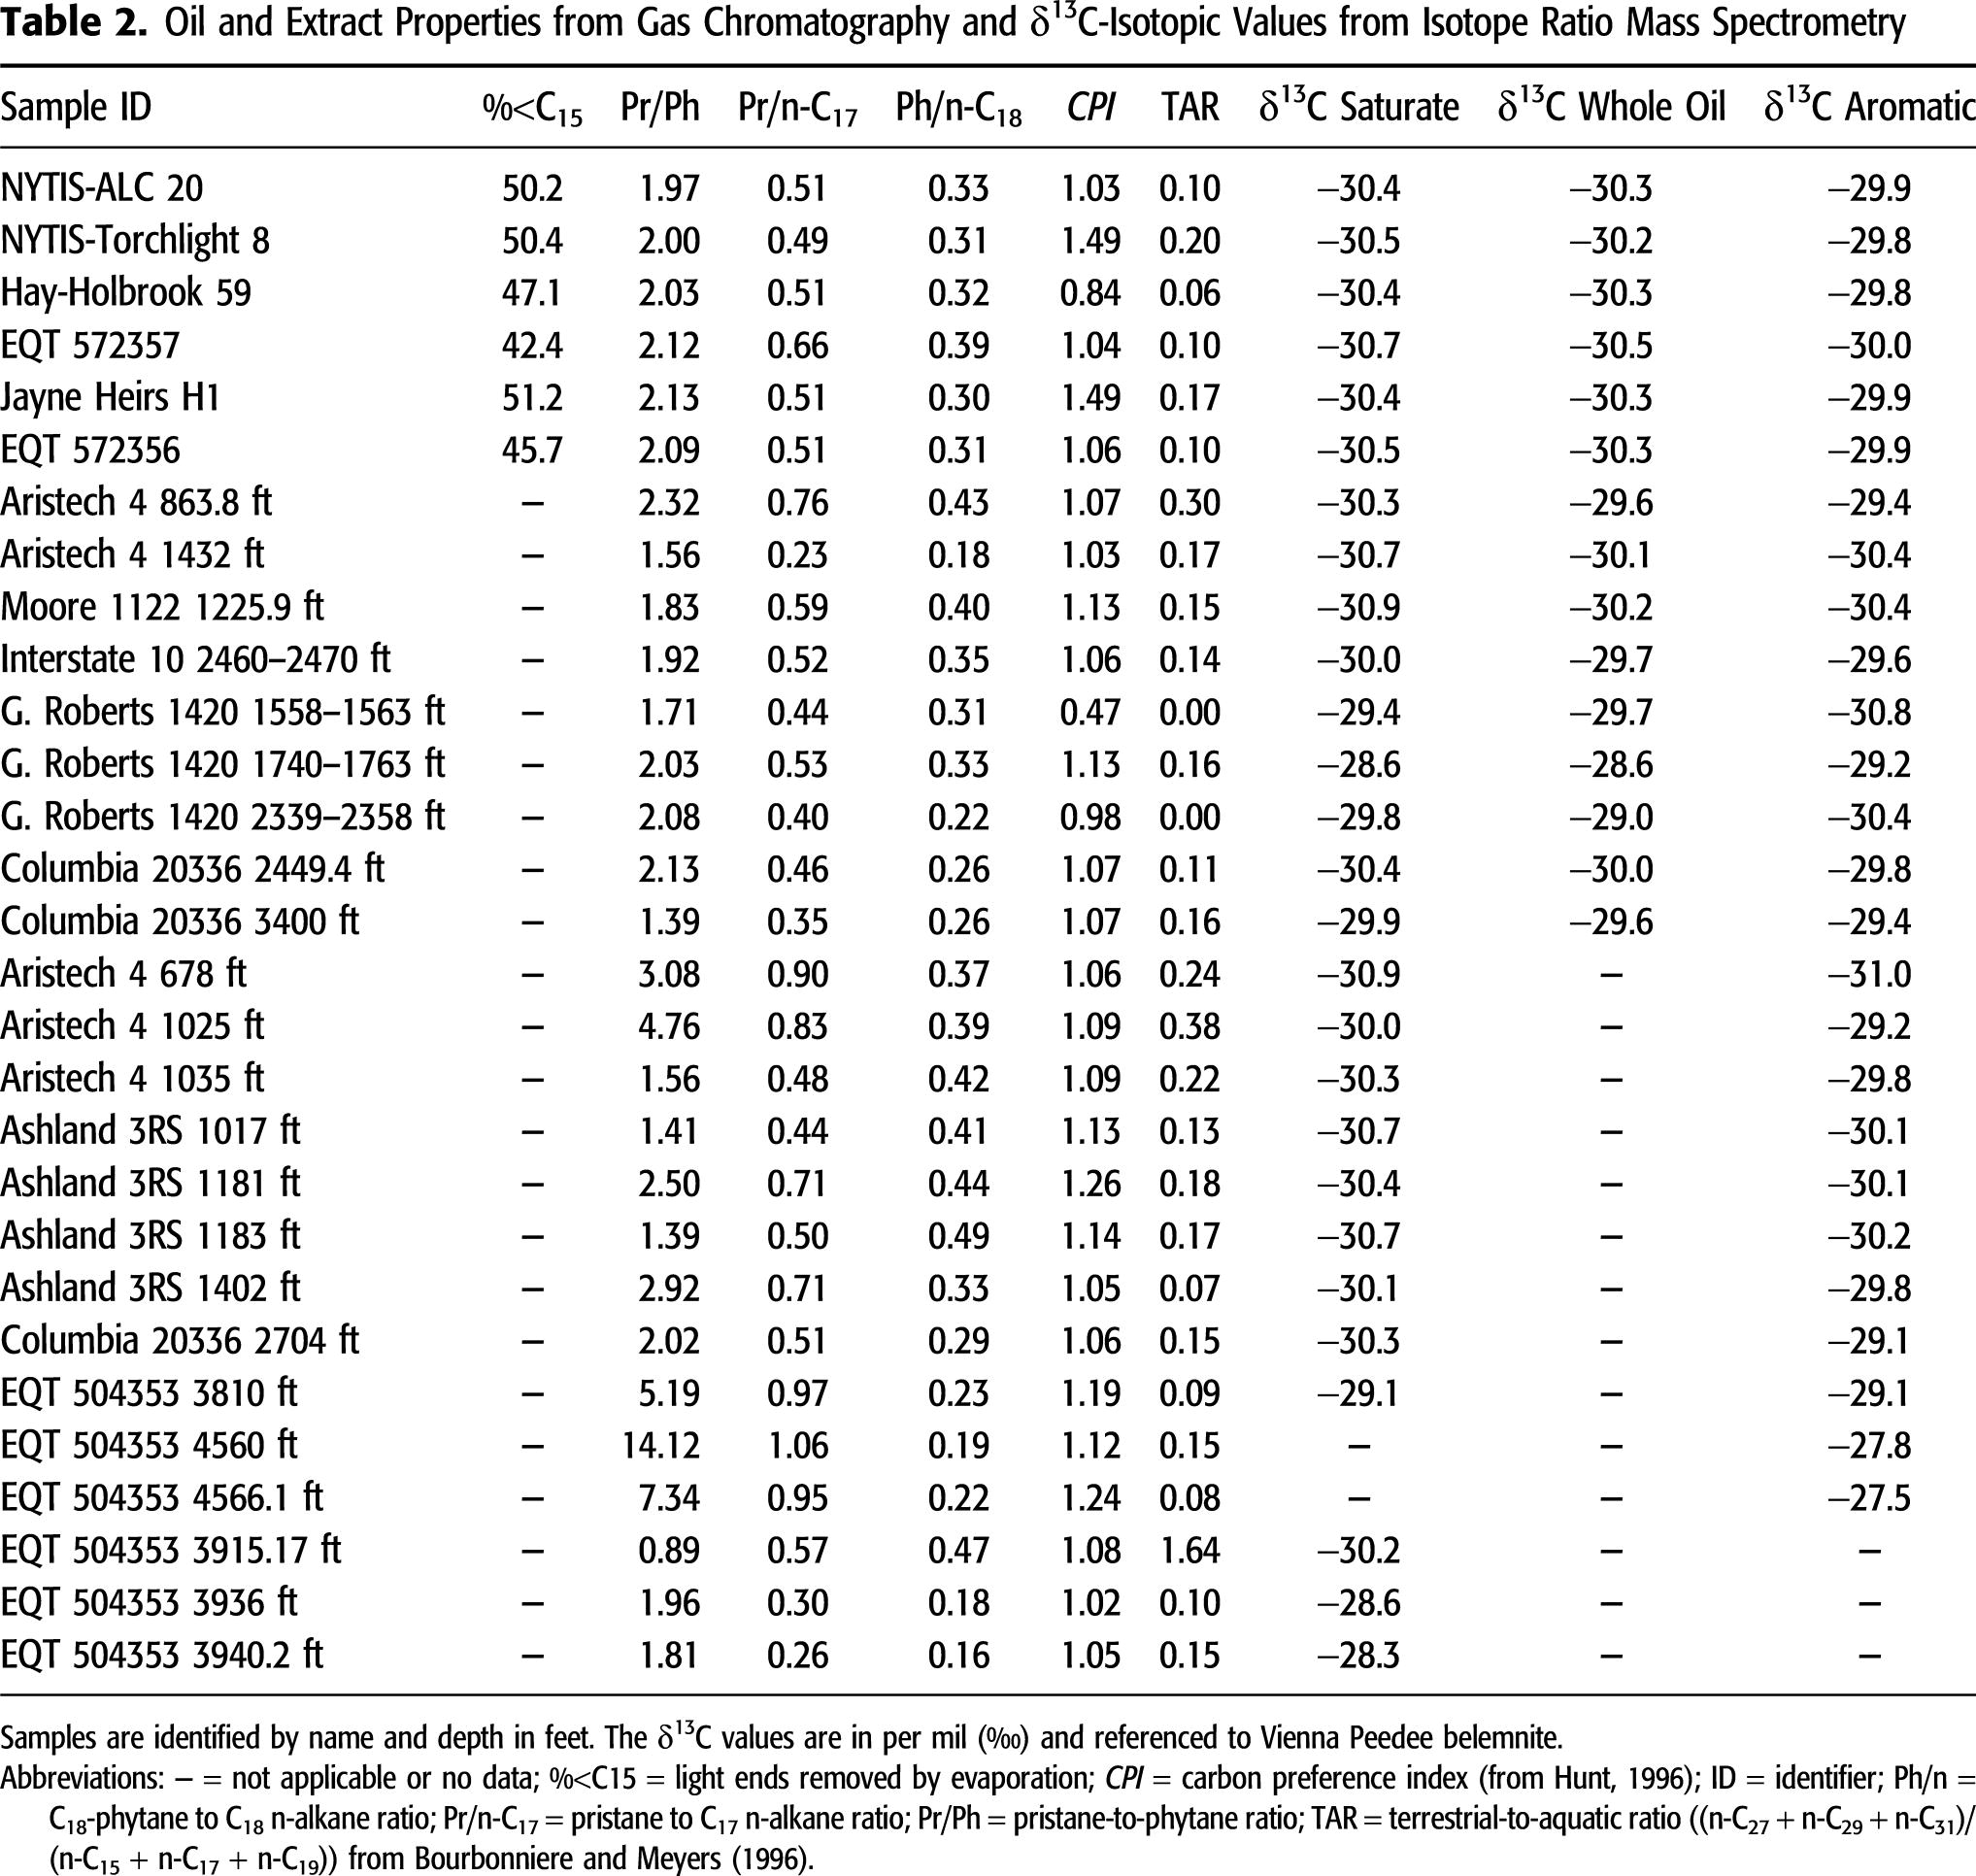
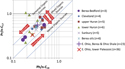 Figure 4. Discriminant plot of pristane (Pr)/n-C17 and phytane (Ph)/n-C18. Average Berea and Ohio Shale–reservoired (n = 23) and lower Paleozoic–reservoired (n = 36) oil from eastern (E.) Ohio based on data from GeoMark (2015). Organic source fields and process directions after Shanmugam (1985). Modified from Parris et al. (2019) with permission of Kentucky Geological Survey.
Carbon Isotope Composition
Whole-oil and solvent extract carbon isotopic values are compiled in Table 2 with carbon isotope values from saturate and aromatic fractions. When the carbon isotopic values are discriminated in a Sofer-type plot (Sofer, 1984), all values plot in the marine sector (Figure 5). Berea oil samples are tightly clustered within a narrow range of approximately 0.3‰ in the saturate component and 0.2‰ in the aromatic component. Source rock solvent extracts show a broader range of carbon isotopic compositions but plot close to the Berea oils. On the Galimov-type plot (Stahl, 1978), the six oil samples also are tightly clustered, showing increasing enrichment in 13C with increasing fraction polarity (Figure 6). Source rock solvent extracts show more variability; six of nine samples are enriched relative to oils in the saturate and whole-oil fraction, but two of these samples (cuttings) show relative depletion in the aromatic fraction. These two samples contain the lowest proportion of aromatics according to column chromatography results. Saturate and aromatic fractions in two solvent extracts (from core) are slightly depleted in 13C relative to Berea oils. Four solvent extract samples show similar patterns to the oils with enrichment increasing with compound class polarity.
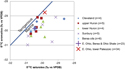 Figure 5. Sofer-type plot of δ13C-isotopic composition (Sofer, 1984). Typical standard deviations of carbon isotopic composition are ±0.1‰. Average Berea- and Ohio Shale–reservoired (n = 23) and lower Paleozoic–reservoired (n = 34) oil from eastern (E.) Ohio shown for comparison using data from GeoMark (2015). Modified from Parris et al. (2019) with permission of Kentucky Geological Survey. VPDB = Vienna Peedee belemnite.
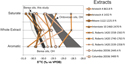 Figure 6. Galimov-type plot of δ13C-isotopic composition. Typical standard deviations of carbon isotopic composition are ±0.1‰. Data fields for Berea and Ordovician oils from Ohio (OH) are from Cole et al. (1987). Samples are identified by well name and depth in feet. Modified from Parris et al. (2019) with permission of Kentucky Geological Survey. VPDB = Vienna Peedee belemnite.
Biomarker Characterization from Gas Chromatography–Mass Spectrometry
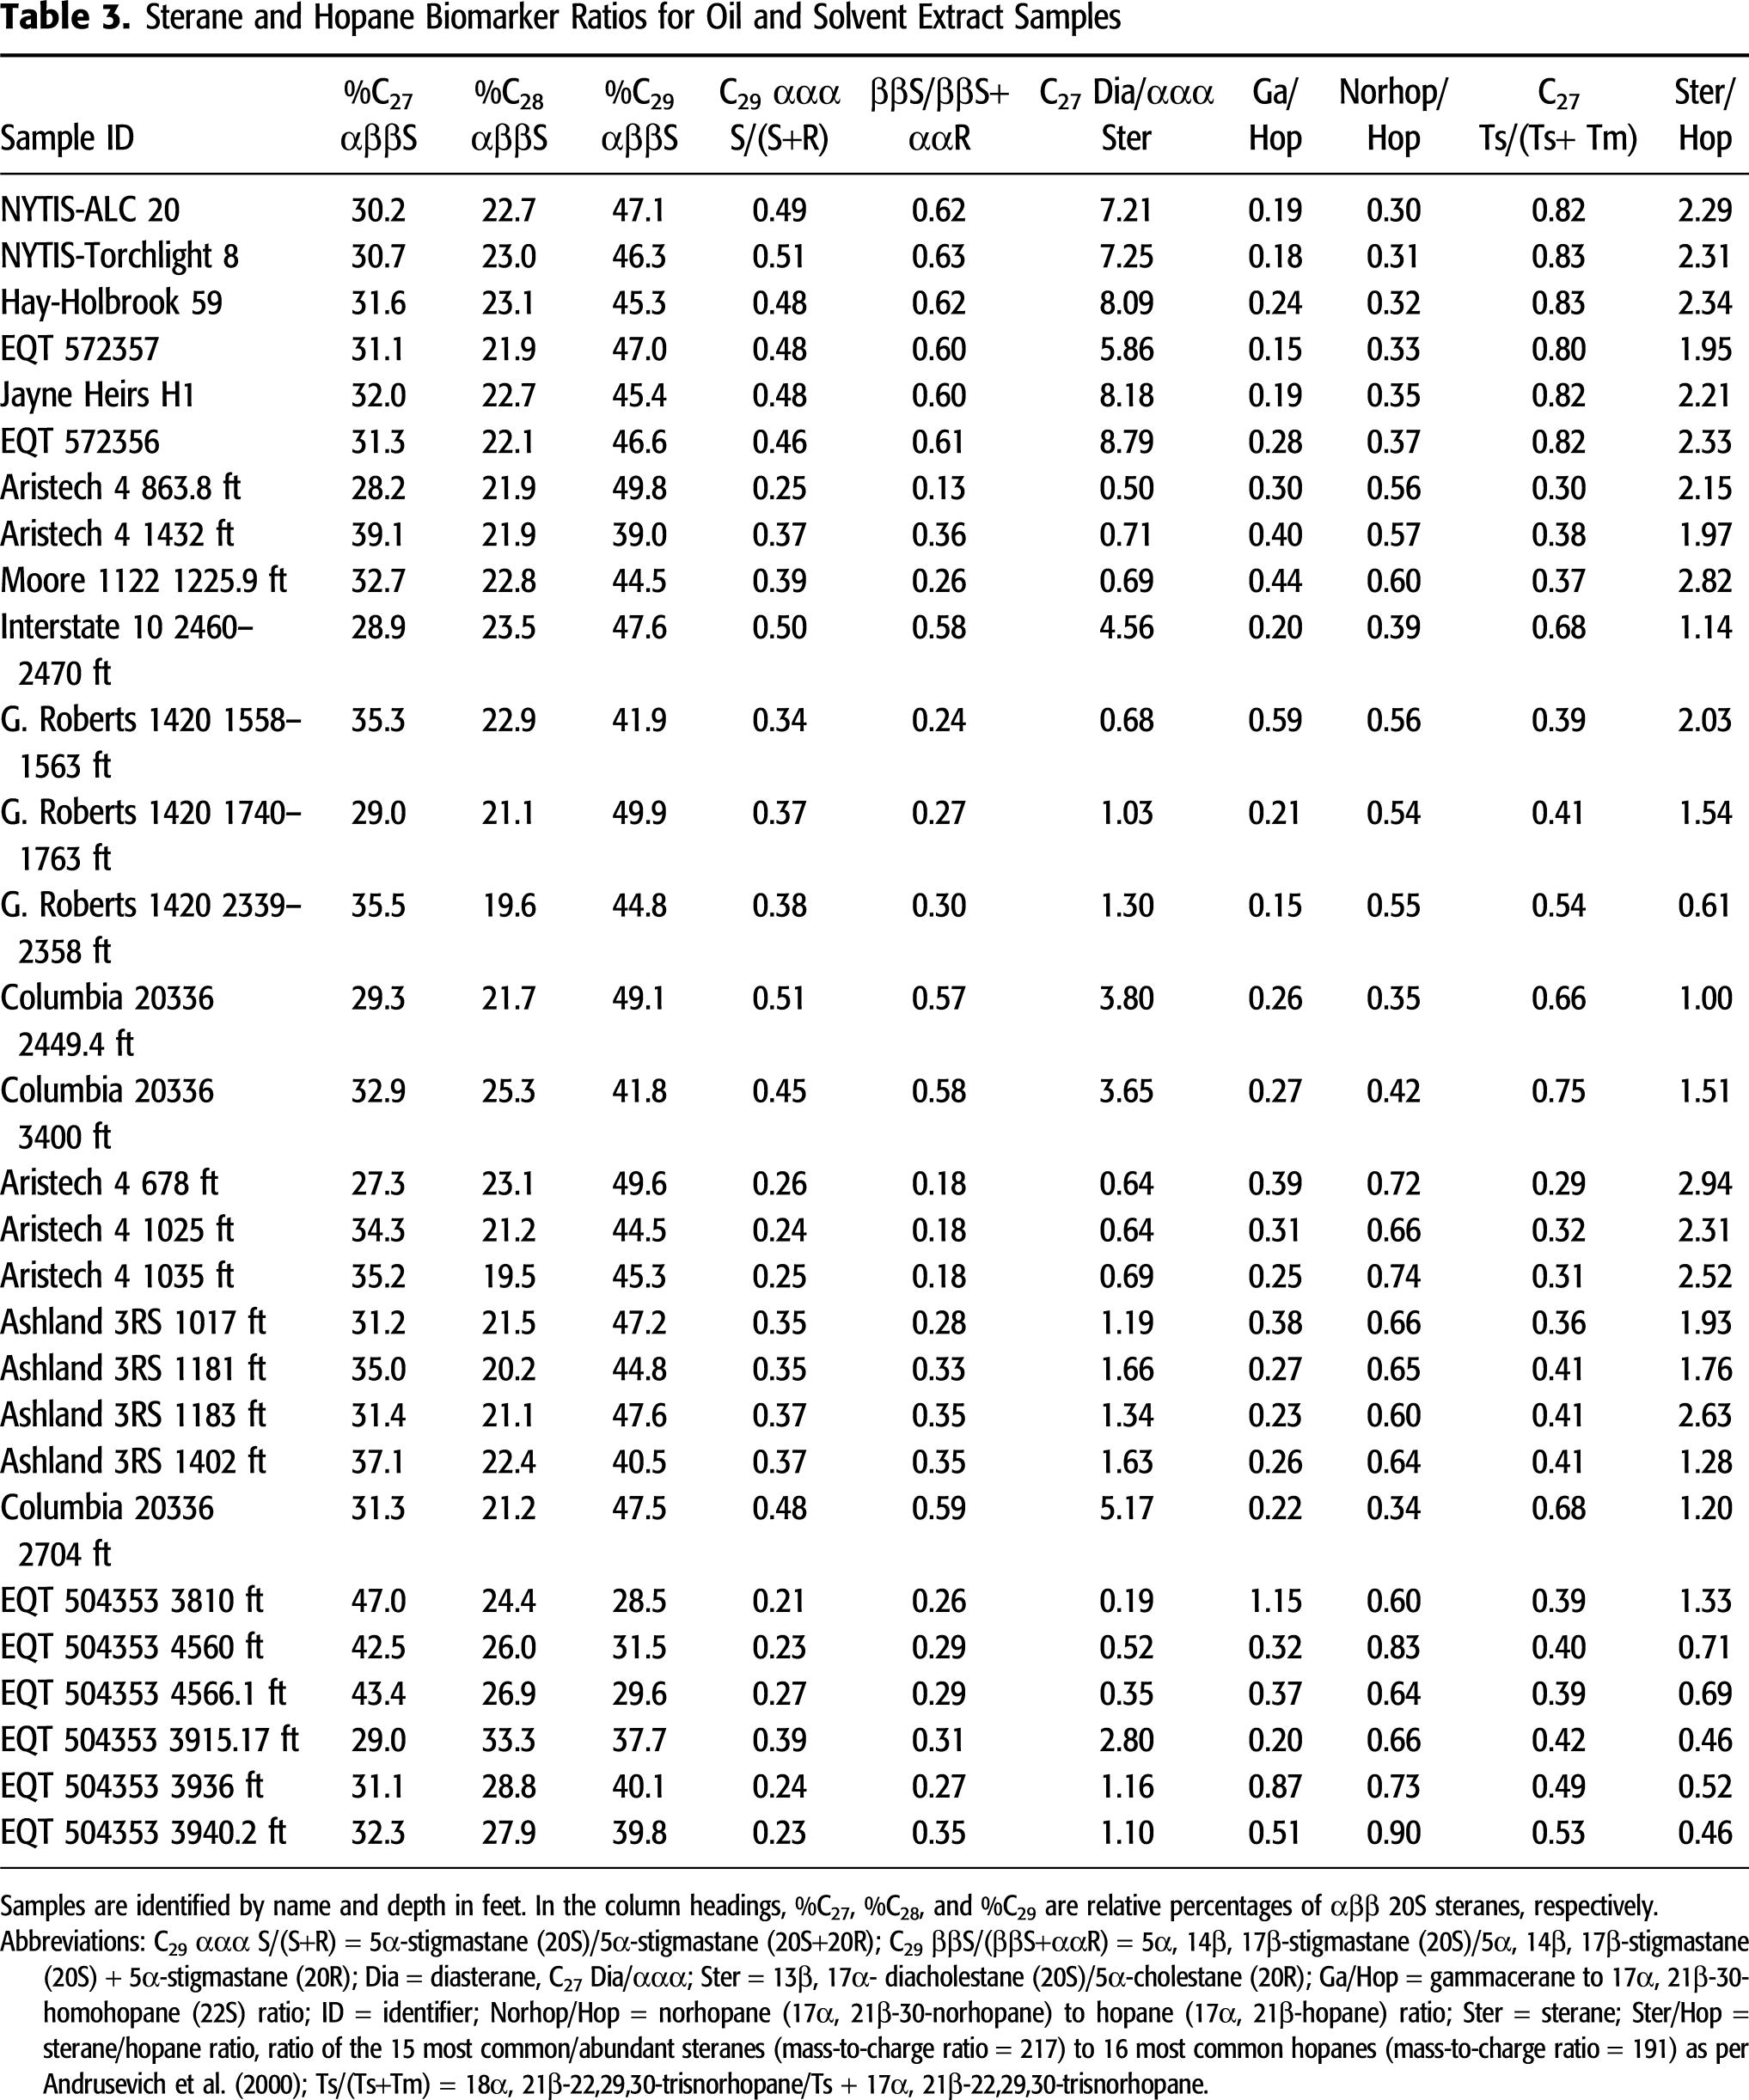
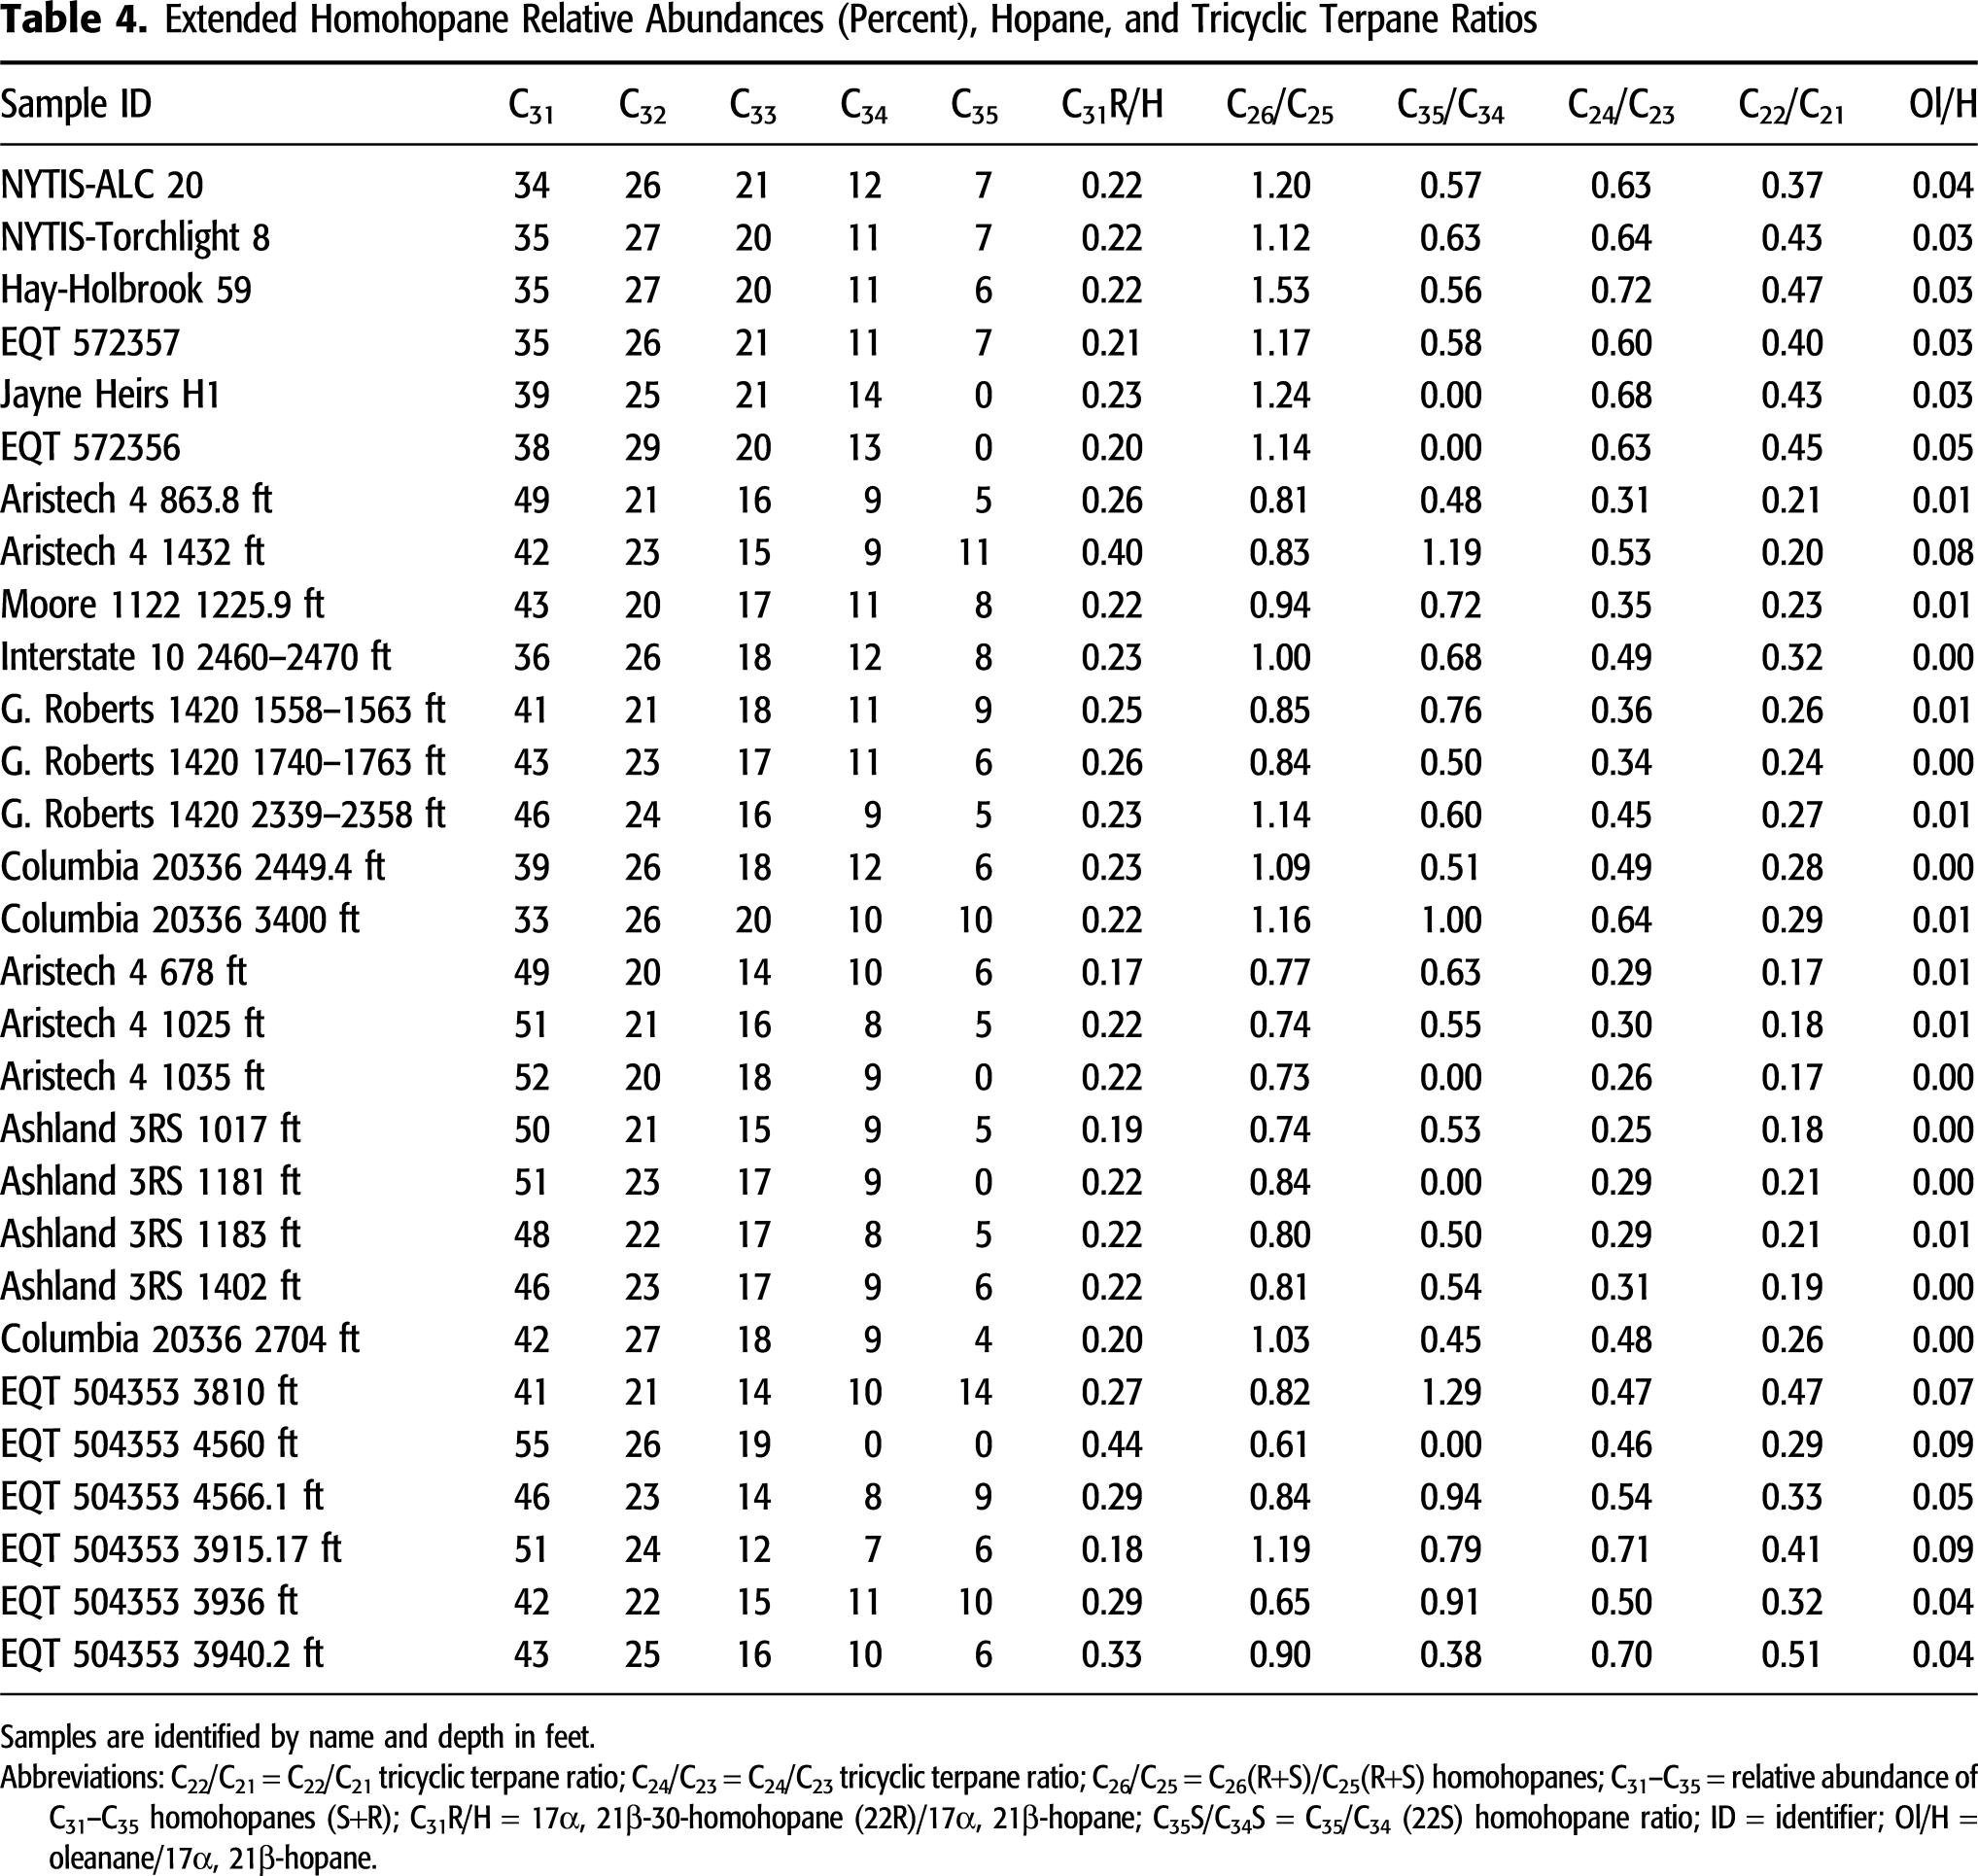
Sterane and hopane biomarker ratios from GC-MS analysis of crude oils and solvent extracts are compiled in Tables 3 and 4. Previous work by Cole et al. (1987) did not identify sterane and hopane compounds in oil samples from eastern Ohio, which they speculated was caused by advanced thermal maturity. However, more recent work has obtained robust sterane and hopane biomarker results from Devonian shales at midoil window thermal maturity in eastern Ohio and western New York (Hackley et al., 2013; Haddad et al., 2016; Martinez et al., 2019). The current study obtained mass fragmentograms from all analyzed crude oil and solvent extract samples. Solvent extract fragmentograms for m/z 191 and 217 are illustrated in Figure S3 (supplementary material available as AAPG Datashare 128 at www.aapg.org/datashare) for the low-maturity Aristech well and the high-maturity EQT 504353 well (see Figure S3 for peak label identifications). Chromatographic column bleed (the signal generated by column stationary phase bleeding out of the column) is suggested by rising baselines (Peters et al., 2005) in some of the m/z 191 fragmentograms, particularly in the high-maturity extracts from the downdip Pike County EQT 504353 well (Figure S3).
Sterane (5α, 14β, 17β (20S), m/z 218) distributions are shown in Figure 7. Crude oils and solvent extracts are tightly clustered except the extracts from the high-maturity EQT 504353 well in Pike County. Three of the EQT 504353 well solvent extract samples are depleted in the C29 component, whereas the three other samples (Berea and Bedford) from this well are more similar to the oil and other solvent extracts with a slight enrichment in the C28 component.
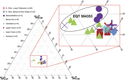 Figure 7. Sterane [5α, 14β, 17β (20S), mass-to-charge ratio 218] distributions. The EQT 504353 label refers to the six solvent extract analyses from the downdip high-maturity EQT 504353 well. Average Berea- and Ohio Shale–reservoired (n = 23) and lower Paleozoic–reservoired (n = 34) oil from eastern (E.) Ohio shown for comparison using data from GeoMark (2015). Modified from Parris et al. (2019) with permission of Kentucky Geological Survey.
Crude oils show a strong relationship between concentrations of individual sterane and hopane compounds (Table S1, supplementary material available as AAPG Datashare 128 at www.aapg.org/datashare). For example, concentrations of C30H (17α, 21β-hopane) are strongly correlated to C27 5α, 14β, 17β-cholestane (20R) +13β, 17α-diastigmastane (20S) (coefficient of determination [R2] = 0.96; Figure S4A, supplementary material available as AAPG Datashare 128 at www.aapg.org/datashare), 17α, 21β-30-homohopane (22S+22R) to 13β, 17α-diacholestane (20S+20R) (R2 = 0.94; Figure S4B), and Tm 17α, 21β-22,29,30-trisnorhopane to 5α-stigmastane (20S) (R2 = 0.92; Figure S4C). These relationships are consistent with the Berea oil samples being from a single family of oils, with slight variations in thermal maturity (Seifert and Moldowan, 1978; Peters et al., 2005). Figure S4 (supplementary material available as AAPG Datashare 128 at www.aapg.org/datashare)shows only a subset of individual correlated sterane and hopane compounds; other sterane and hopane molecules show similar strong correlations (e.g., 5α-ergostane (20R) and 17α, 21β-bishomohopane (22S), R2 = 0.93). The strong correlations present in their concentrations also suggest that ratios of individual hopane and steranes will remain relatively constant among Berea oils.
The C31–C35 homohopane distributions also are very similar among the oil samples (Figure 8; Table 4), again implying a genetic relationship (Peters et al., 2005). The C35 hopane was not detected in oil samples from the EQT 572356 or Jayne Heirs H1 wells in Johnson County. As compared to Berea oils, homohopane distributions in source rock solvent extracts generally show higher concentrations of C31, lower concentrations of C32–33, lower-to-similar concentrations of C34, and similar concentrations of C35. With minor exceptions, as illustrated in Figure 8, the average values of homohopane relative abundances are very similar for the different source rock candidate solvent extracts and are also similar to the Berea oils.
 Figure 8. Average values for extended homohopane abundances in Berea oils and source rock solvent extracts. The polygon labeled Berea oils encompasses all Berea oil compositions.
Aromatic biomarker results are compiled in Table 5. Methylphenanthrene index (MPI) values (Radke and Welte, 1983) show a narrow range of 0.61–0.70 in oils and a broader range of 0.46–1.05 in solvent extracts. Ratios of dibenzothiophene to phenanthrene (DBT/P) (Hughes et al., 1995) are uniformly low for oils and solvent extracts, ranging from 0.01 to 0.65. Values for alkyl-dibenzothiophene ratio (MDR) (Radke et al., 1986) range from 0.45 to 16.92 (discounting the ratio of 162 reported for high-maturity sample EQT 504353 3940.2 ft). Triaromatic steroid ratios also are included in Table 5, and although, in some cases, they show strong positive correlations to other triaromatic ratios, these values are poorly related to thermal maturity as determined by VRo or saturate biomarker ratios. This feature of the data set may be caused by poor signal in some m/z 231 fragmentograms, particularly in higher-maturity samples.
DISCUSSION
Oil–Oil Correlation
The crude oil samples are essentially identical in bulk composition, with very narrow ranges of values for API gravity, sulfur, and SARA fractions (Figure 3). Figure 3 includes for comparison the average bulk SARA properties of Devonian Berea and Ohio Shale–reservoired (n = 23) and lower Paleozoic-reservoired (n = 35) oils from eastern Ohio (data from GeoMark, 2015) and fields that show the range of compositions for these oil families. Berea oils in this study contain lower saturate and higher aromatic proportion than either of the average Devonian or lower Paleozoic oils from Ohio, although the full range of data from both oil groups contains some samples similar to the Berea oils of this study. Carbon isotopic compositions from whole Berea oils and fractions also show a narrow compositional distribution (Figures 5, 6). Berea oil samples are identical in isotopic composition relative to an average composition computed from 23 saturate–aromatic carbon isotopic pairs contained in the GeoMark (2015) database from Ohio Shale– and Berea-reservoired oils from eastern Ohio and are depleted relative to an average lower Paleozoic oil (Figure 5). The similarity in bulk oil properties, including n-alkane envelopes (Figure S1, supplementary material available as AAPG Datashare 128 at www.aapg.org/datashare), is consistent with all samples coming from the same or similar sources (e.g., Zhang and Huang, 2005; Huang et al., 2016). Oil samples are virtually identical in αββ sterane to the average (n = 23) Berea and Ohio Shale oil or lower Paleozoic oil (n = 29) from eastern Ohio computed from the GeoMark (2015) database (Figure 7), whereas solvent extract samples are similar with slightly greater contributions from the C27 and C28 marine components relative to the average Berea–Ohio Shale oil from Ohio. Strong correlations observed between individual sterane and hopane concentrations (Figure S4, supplementary material available as AAPG Datashare 128 at www.aapg.org/datashare), similarity in extended hopane concentrations (Figure 8), and similar thermal maturity as computed from MPI and MDR (e.g., Mashhadi and Rabbani, 2015; El Diasty et al., 2016; Słowakiewicz et al., 2018) also support an interpretation of one oil family. Based on these observations, we conclude the oils reservoired in Berea siltstones from Greenup County southeast to Martin County originated from the same or from similar source rocks.
Sources of Organic Matter
Unimodal n-alkane distributions in oils with predominance of <C15 components are consistent with a marine organic matter source (Blumer et al., 1971), as known from the geology of the Devonian to Mississippian section in the study area (Ettensohn and Elam, 1985; Pashin and Ettensohn, 1987). The Pr/Ph values of 1.97–2.13 are consistent with a marine oil source and with low terrestrial-to-aquatic ratios ((n-C27+n-C29+n-C31)/(n-C15+n-C17+n-C19); Bourbonniere and Meyers, 1996) of 0.06–0.20. The CPI values of approximately 1 in immature solvent extracts from the Aristech well and the n-alkane maxima centered at C15–17 also are consistent with a dominant marine component to the organic matter as these characteristics would otherwise be suggestive of higher-maturity organic matter. Overall, the CPI values generally range from 1.0 to 1.15 for most solvent extracts, also consistent with a marine organic matter source. Minor C27–31 peaks in solvent extracts may be contaminants or may reflect the presence of scattered terrigenous organic matter as revealed through petrography (Eble et al., 2021, this issue), primarily in the form of inertinite with lesser amounts of vitrinite. The Pr/n-C17 versus Ph/n-C18 discriminant plot (Figure 4) also indicates a mixed terrigenous–marine organic matter source, possibly reflecting the minor terrigenous organic component, although the Sofer-type discriminant diagram (Figure 5) clearly shows a marine signature.
Sterane distributions show a dominant C29 contribution from green algae (e.g., Grantham and Wakefield, 1988; Schwark and Empt, 2006; Kodner et al., 2008). Older work has suggested C29 steranes may indicate a terrigenous contribution to organic matter (Huang and Meinschein, 1979) and minor woody organic matter from higher land plants (vitrinite and inertinite) is present in the source rocks, as documented via organic petrography (Eble et al., 2021, this issue). Vitrinite and inertinite are, however, minor components relative to organic matter representing or derived from marine algae (Tasmanites, unidentified algal material [telalginite, lamalginite], and biodegradation products [bituminite]). Because we have direct proxies indicating a dominant marine organic matter source from organic petrography (Eble et al., 2021, this issue), we suggest the observed sterane distributions are representative of marine organic matter, in particular, photosynthetic green algae, which may synthesize precursors to C29 steranes (Volkman, 1986; Schwark and Empt, 2006). A minor C30 sterane component (Figure S3, supplementary material available as AAPG Datashare 128 at www.aapg.org/datashare) also supports a marine source of organic matter (Moldowan et al., 1990).
Gammacerane index values of Berea oils and solvent extracts are similar to eastern Ohio Devonian oils (Figure 9) and to the computed average value for distal marine shale (not shown; data from GeoMark, 2015) and suggest that normal mesohaline (nonstratified, low to normal marine salinity) conditions predominated (Sinninghe Damsté et al., 1995). High diasterane-to-sterane ratios (0.2 to 5.2; Table 3) in source rock solvent extracts are consistent with the clay mineral-rich mineralogy of the Devonian–Mississippian black shales (e.g., Mello et al., 1988) and similar to high diasterane-to-sterane ratios in eastern Ohio Devonian oils (average 5.6, n = 20; data from GeoMark, 2015). Very slight concentrations of oleanane, a biomarker for terrestrial angiosperms present in the Cretaceous and younger (Ekweozor et al., 1979), are present in Berea oils and the majority of solvent extracts (Table 4). It is unlikely this compound originated in the Devonian oil or solvent extract samples, and it may represent minor contamination or coelution of another compound.
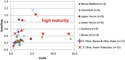 Figure 9. Gammacerane index (Gam/Hop; ratio of gammacerane to 17α, 21β-30-homohopane (22R)) versus pristane-to-phytane (Pr/Ph) for Berea oils and solvent extracts. Data for average (n = 21) eastern (E.) Ohio Devonian oil from GeoMark (2015). Red arrows point to high-maturity solvent extracts from the EQT 504353 well. Modified from Parris et al. (2019) with permission of Kentucky Geological Survey.
Tricyclic terpanes (Figure 10; Table 4), present in all crude oils and solvent extracts, may originate from Tasmanites algae (Azevedo et al., 1992) or from prokaryotic (bacterial) membranes (Ourisson et al., 1982). Tasmanites is present in all of the immature samples (Eble et al., 2021, this issue). Also present is amorphous organic matter that may include some component of bacterial biomass. Tricyclic terpane ratios are consistent with a marine source of organic matter in the Berea petroleum system when compared to an average tricyclic terpane ratio from distal marine shale as computed from the GeoMark (2015) database (not shown). Figure 10A–C shows hopane and tricyclic terpane ratios in commonly used scattered plots (e.g., Peters et al., 2005) in comparison to the averages of eastern Ohio Devonian and lower Paleozoic oil compositions (data from GeoMark, 2015). Berea oils in this study generally are comparable in composition to the eastern Ohio oils, which show little separation in hopane ratios or the C26/C25 tricyclic terpane ratio (Figure 10B). In contrast, some separation is observed in C24/C23 and C22/C21 tricyclic terpane ratios (Figure 10C); below, we speculate this may be because of phase separation. The C24/C23 ratios lower than 0.5 may reflect a minor carbonate influence in some of the Devonian shales analyzed in this study, as confirmed by petrography and total C analyses (Eble et al., 2021, this issue). Low DBT/P (Table 5) ratios are consistent with a marine shale depositional environment according to the Hughes et al. (1995) discriminant plot. Last, total sterane-to-hopane ratios >1.0 (Table 3) suggest eukaryotic organic matter (marine algae) dominates the organic source input (Volkman, 1986). In summary, all of the available geochemical, petrographic, and geologic evidence indicates a marine source of organic matter, predominantly photosynthetic green algae and bacteria, as previously suggested by scientists examining the geochemistry of the Ohio Shale and equivalent strata (Kroon and Castle, 2011; Haddad et al., 2016; Martinez et al., 2019).
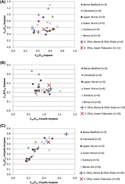 Figure 10. Tricyclic terpane and hopane ratios. (A) C35/C34 hopane versus C29/C30 hopane. (B) C31R/C30 hopane versus C26/C25 tricyclic terpane. (C) C24/C23 tricyclic terpane versus C22/C21 tricyclic terpane. Data for average eastern (E.) Ohio Devonian and lower Paleozoic oils from GeoMark (2015). Modified from Parris et al. (2019) with permission of Kentucky Geological Survey.
Oil–Source Rock Correlation
Close correspondence between normal sterane distributions of crude oils and potential source rock extracts (Figure 7) is consistent with Berea oil generation from the analyzed source rocks (e.g., Kara-Gülbay and Korkmaz, 2012; Korkmaz et al., 2013; Bechtel et al., 2014). However, similar sterane distributions in each of the potential source rock extracts prohibits making a definitive correlation between oils and individual source rocks. According to Peters et al. (2005), sterane distributions do not change significantly through the oil generation window. Therefore, the significantly lower C29 sterane component in the three source-rock (not Berea or Bedford) solvent extracts from the EQT 504353 well suggests these are an unlikely source for Berea oils. High diasterane/sterane ratios (Table 3) in Berea oils (5.9–8.8) are consistent with a source in the clay mineral-rich Devonian–Mississippian black shales.
High Pr/Ph and lighter carbon isotopic compositions in the Berea oils appear to rule out a lower Paleozoic source. Cole et al. (1987) showed that the Ordovician-sourced oils of eastern Ohio contained Pr/Ph values generally lower than 1.8 and aromatic fraction isotopic compositions as heavy as −28‰. Berea oils from this study instead show strong similarity to Berea-reservoired oils in Ohio studied by Cole et al. (1987). In particular, the carbon isotopic compositions are very similar between the two areas (Figure 6). Cole et al. (1987) used carbon isotopic compositions of Berea oils relative to kerogen and kerogen pyrolyzate of Sunbury source rocks to select the Sunbury as the most likely source of Berea oils in eastern Ohio. This decision appears to have been based on its proximity (immediately overlying the Berea). However, Cole et al. (1987) also indicated that the underlying Ohio or Olentangy shales could have sourced the Berea-reservoired oils. In Figure 6, solvent extracts from the Sunbury, Cleveland, and lower Huron are slightly heavier (up to ∼0.75‰) than Berea oils and show similar carbon isotopic distributions among the saturate, whole extract, and aromatic fractions. Thus, any of these intervals are a potential source for Berea oils, and the isotopic similarity precludes selecting a preferred source rock, similar to the result found by Hackley and Ryder (2021, this issue) for the Berea petroleum system to the north in eastern Ohio. Similarity in tricyclic terpane ratios (Figure 10) between solvent extracts and Berea oils also precludes selecting a preferred source rock. Total sterane/hopane ratios in Sunbury and upper Huron solvent extracts show more similarity to Berea oils than either of the Cleveland or lower Huron extracts; however, this observation does not rule out the Cleveland or lower Huron as sources.
Thermal Maturity
Measurements of VRo from across the full burial and thermal maturity spectrum in this study range from approximately 0.5%, at the northwest end of the study area, where samples occur between 420 and 1830 ft (130 and 560 m), to approximately 1.3%, at the southeast end, where samples occur between 3705 and 4607 ft (1130 and 1405 m) (Eble et al., 2021, this issue). Solid bitumen reflectance measurements on the same samples range from approximately 0.3% to 1.4%. As documented by Eble et al. (2021, this issue), at thermal maturities up to peak oil generation (∼1.0% VRo), solid bitumen is consistently lower in reflectance than co-occurring vitrinite. This observation indicates that vitrinite reflectance suppression is not present in the source rock samples examined herein, as previously suggested (Hackley et al., 2013; Ryder et al., 2013), and that differences between co-occurring vitrinite and solid bitumen reflectance can be attributed to differences in their maturation kinetics (Hackley and Lewan, 2018).
Sterane isomerization ratios from solvent extracts can be used to predict thermal maturity of source rock organic matter, although cautions are suggested, including calibration of isomerization ratios for individual basins and source rocks (Waples and Machihara, 1991; Peters et al., 2005). North of our study area in eastern Ohio, Hackley et al. (2013) used sterane isomerization ratios to show equivalent Devonian shale source rocks (Ohio Shale, Huron Member) were mature for oil generation although VRo (probably solid bitumen reflectance) values suggested immature conditions. The 5α, 14α, 17α 20S/(20S+20R) isomer ratios of C29 steranes are known to approach an empirical thermal equilibrium value of 0.52–0.55 (Seifert and Moldowan, 1986), as exhibited by Berea oils and some of the solvent extracts of this study (Figure 11; Table 3). This may suggest equivalent VRo values of approximately 0.8% (Peters et al., 2005, their figure 14.3) for these samples, although, caution is suggested as stated above, for the VRo equivalent values are inferred from observations outside of the Berea petroleum system. Measured VRo values are approximately 0.73%–0.74% for samples from the same wells and approximate depths as the aforementioned solvent extracts (Table 1). These observations may suggest Berea oils were generated at thermal maturities of approximately 0.7%–0.8% VRo. Isomer ratios for C29 14β, 17β 20S/(ββS+ααR) steranes reach an empirical thermal equilibrium at approximately 0.70 (VRo equivalent value of ∼0.9%; Peters et al., 2005, their figure 14.3). The C29 ββS/(ββS+ααR) ratios from samples in this study that are at the approximate C29 ααα 20S/(20S+20R) equilibrium do not quite reach the 0.7 equilibrium value for C29 ββS/(ββS+ααR) and instead cluster at approximately 0.60. Nonequilibrium values in three high-maturity extract samples from the EQT 504353 well may reflect signal-to-noise issues or destruction of biomarker molecules. Cole et al. (1987) also suspected high maturity was responsible for nondetection of sterane and hopane biomarkers in oils from similar maturity thermal regimes (1.1%–1.3% VRo; Table 1) in eastern Ohio. Sterane isomerization ratios for the remaining extracts and oil samples show a strong positive correlation (R2 = 0.90), confirming the validity of the two thermal maturity parameters. Excluding the three EQT samples, sterane isomerization ratios also show moderate correlations with average measured VRo values from each well (R2 = 0.75 for C29 ββS/(ββS+ααR) and 0.71 for C29 ααα 20S/(20S+20R)). In summary, ααα 20S/(20S+20R) sterane isomerization ratios suggest VRo equivalent values of 0.7%–0.8% for oil generation in the Berea system and possibly as high as approximately 0.9% if ββS/(ββS+ααR) values are at equilibrium.
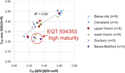 Figure 11. Sterane isomerization ratios. Red arrows point to high-maturity samples from EQT 504353 well that are excluded from linear regression line. Modified from Parris et al. (2019) with permission of Kentucky Geological Survey. R2 = coefficient of determination.
Excluding the three samples from the high-maturity EQT 504353 well, C27 trisnorhopane epimer ratios (Ts/Ts+Tm) (Table 3) show a moderate positive relationship (R2 = 0.67) with average measured VRo values from each well and strong correlations to sterane isomerization ratios (R2 = 0.81 for 20S/(20S+20R) and 0.93 for ββS/(ββS+ααR)), indicating the utility of this thermal maturity parameter in the Berea petroleum system. The Ts/Ts+Tm ratios also show a strong relationship to diasterane/sterane ratios (R2 = 0.93, not shown, see data in Table 3). Because both of these ratios are in part dependent on organic source and depositional environment (Moldowan et al., 1986; Mello et al., 1988), in addition to thermal maturity, their correspondence is additional evidence suggesting oils and solvent extracts are related and from a similar organic matter source. The Ts/(Ts+Tm) ratio reaches thermal equilibrium at 1.0 (which is not reached in our data set), equivalent to approximately 1.4% VRo (Peters et al., 2005, their figure 14.3). Oil samples show a moderate correlation between Ts/Ts+Tm and ββS/(ββS+ααR) (R2 = 0.67), suggesting a slight difference in thermal maturity among the samples, as pointed out earlier from correlations between individual hopane and sterane abundances. However, no relationship is observed between 20S/(20S+20R) and Ts/Ts+Tm ratios in oil samples (R2 = 0.30).
A poor negative correlation is observed between sulfur content in solvent extracts and VRo values (R2 = 0.42, not shown, see data in Table 1). However, when Cleveland samples (n = 3) are excluded, R2 improves to 0.85 (the Cleveland samples define a separate, lower sulfur trend, which also shows a strong inverse correlation to thermal maturity with R2 = 0.99). The inverse correlations observed between organic sulfur content and VRo suggest that cracking of sulfur-containing functional groups may occur during early maturation. The residual organic matter, at higher maturity, has lower sulfur content. Accordingly, the low sulfur content in Berea oils may suggest generation from conversion of kerogen and bitumen of moderate thermal maturity level. There are several cautions with this idea, however; diagenetic sulfurization of organic matter is suggested (although not demonstrated) by high C35 hopane (the C35 hopane is preferentially sulfurized relative to lower carbon number homohopanes according to Köster et al., 1997) in high-maturity Sunbury and lower Huron solvent extracts from the EQT 504353 well (S content is not available). Preferential sulfurization of phytane precursors (Kohnen et al., 1991; De Graaf et al., 1992; Kenig et al., 1995) and their subsequent loss during thermal cracking may be responsible for the low Ph/n-C18 and high Pr/Ph (Figures 4 and 9, respectively) in these same samples. At this maturity, we would expect low sulfur content in the remaining organic matter. However, other samples with high sulfur contents in solvent extracts (Sunbury and lower Huron samples in the G. Roberts 1420 well) do not show elevated C35 hopane.
Absence of C35 and higher C31 hopane in crude oils from the EQT 572356 or Jayne Heirs H1 wells in Johnson County may reflect higher thermal maturity of these oils and cracking from an originally sulfur-rich kerogen. Organic sulfurization preserves a greater proportion of extended homohopanes from C31 through C35 (Köster et al., 1997). These sulfur-bound homohopanes are lost during early cracking of sulfur-rich kerogen, leading to later increase in the C31 homolog (Peters and Moldowan, 1991; Peters et al., 2005). Sulfurization of kerogen in the lower Huron sample from 1432 ft in the Aristech well may be the reason for elevated C35 hopane (Figure 8). This sample contains total sulfur content of 7.53% in the solvent extract, the highest value of the nine samples analyzed. Other scientists have detected carotenoid biomarker isorenieratane in Upper Devonian shales from eastern Ohio and western New York, suggesting the presence of photic zone euxinia, which would aid early sulfurization of organic matter and initial preservation of C35 homohopanes (Haddad et al., 2016; Martinez et al., 2019).
For all three of the tricyclic terpane ratios considered above (C22/C21, C24/C23, and C26/C25; Figure 10), oils show higher values than do solvent extracts. Considering solvent extracts as representative of potential Berea oil sources, this observation is counterintuitive to considerations arising from primary migration and expulsion fractionation during oil generation from bitumen, both of which should favor the lighter tricyclic terpane molecules. We therefore assume oils may show higher tricyclic terpane ratios because of phase separation during migration and loss of some component of the lighter tricyclics or derivative molecules into associated gases, which are produced in the downdip areas of the Berea play (Parris et al., 2021, this issue).
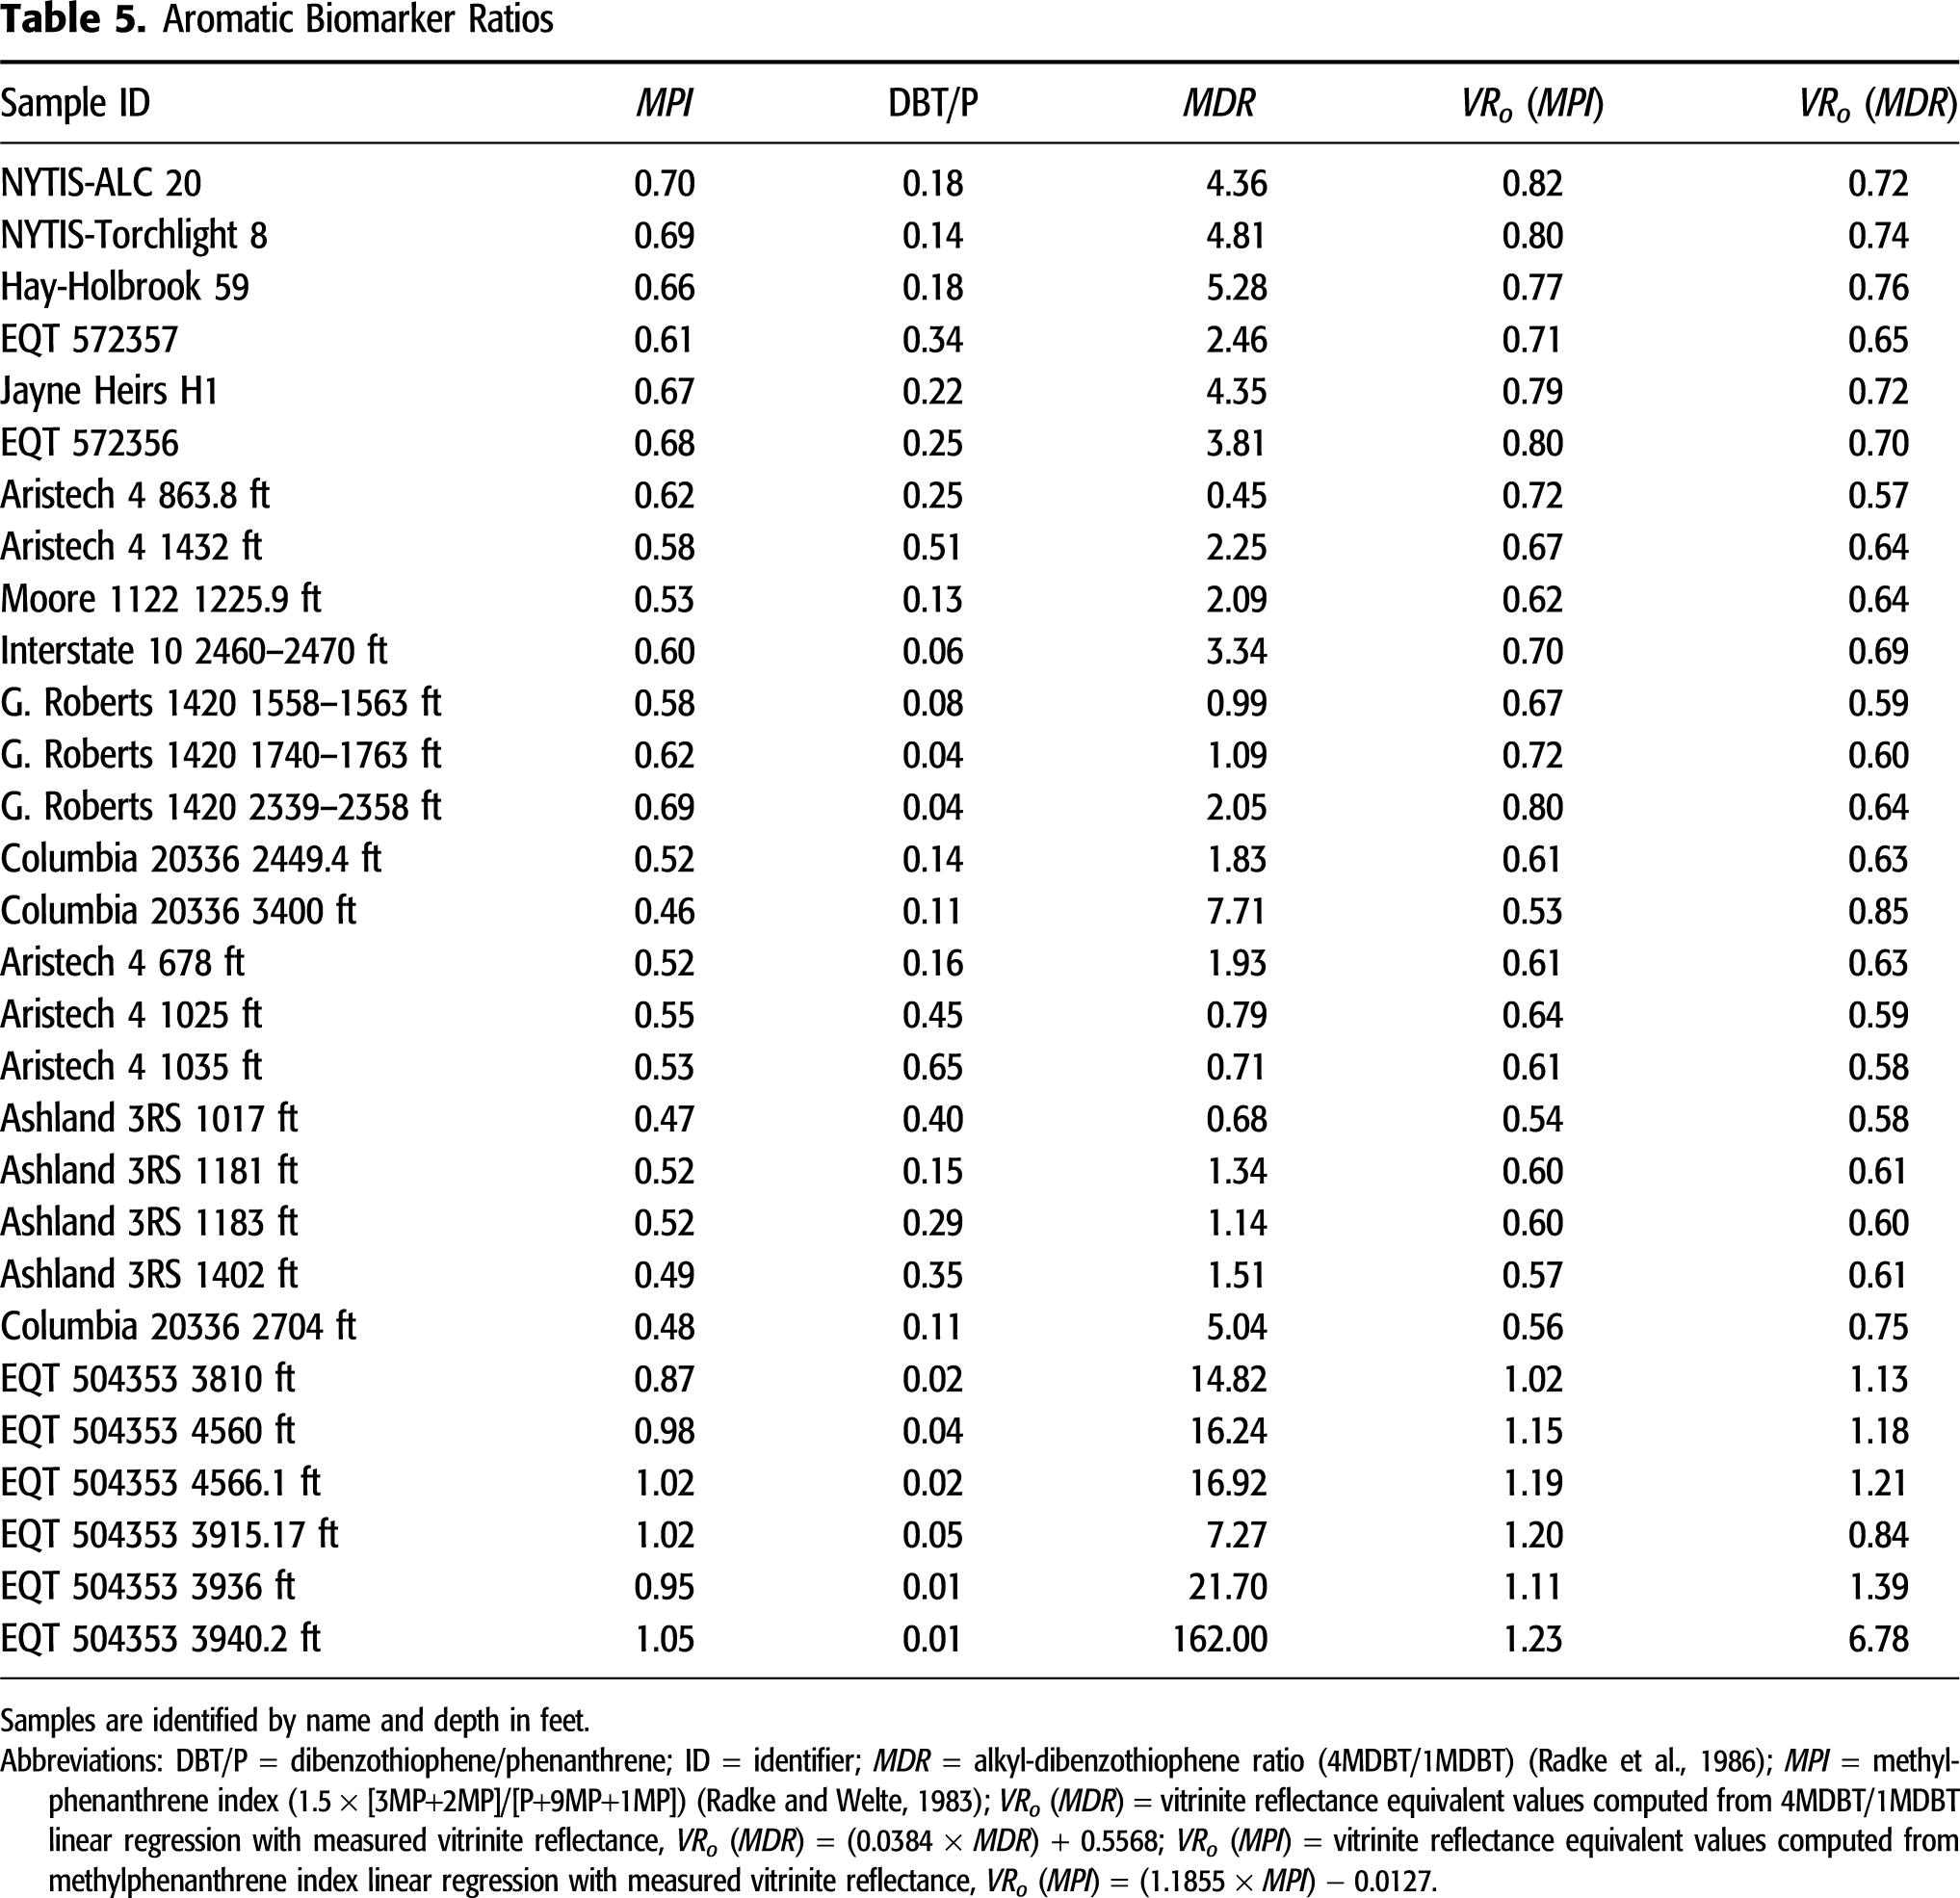
The MPI (Table 5; Radke and Welte, 1983) from aromatic biomarker analysis of the extracts shows a moderate positive correlation with thermal maturity as determined from VRo measurements (R2 = 0.77; Figure 12A), although this relationship is skewed by clusters of data at high and low thermal maturity. Nevertheless, based on these data, a VRo equivalent value can be computed for any sample, including Berea oils, using the linear regression VRo = 1.1855 × MPI−0.0127. In Figure 12B, we show VRo equivalent values from MPI relative to saturate/aromatic ratios from all samples, oils, and solvent extracts. A strong positive relationship (R2 = 0.88) is consistent with oils and extracts being from the same organic matter source and suggests that the saturate/aromatic ratio can be predicted from MPI values. A similar robust relationship (R2 = 0.80) is found using measured VRo values for solvent extract samples and VRo equivalent values from oil MPI. Moreover, this relationship also suggests the sampled Berea oils cracked from bitumens at mid-oil window thermal maturity conditions of approximately 0.7%–0.9% VRo (Radke, 1988), consistent with the interpretation presented above from sterane isomerization ratios. This idea is based on the position of oil samples in Figure 12B and would be consistent with low sulfur content in oils, which also suggests they are not formed from early generation. Because some oils were sampled from updip reservoirs in Greenup County, where thermal maturity is <0.6% VRo, significant updip lateral migration of 30–50 mi from a downdip Devonian black shale source kitchen is required. These observations show there is no need to reevaluate whether the conventional 0.6% VRo value marks the entrance to the oil window in the Devonian petroleum system of eastern Kentucky; all data from oil samples point to generation at thermal maturities >0.6 VRo. Like thermal maturity relationships observed from MPI, the MDR (Radke et al., 1986) from bitumen extracts shows a robust relationship to measured VRo (R2 = 0.81) and can be used to predict equivalent VRo values for Berea oil samples using the linear regression of VRo = 0.0384 × MDR + 0.5568. This relationship predicts VRo equivalent values of 0.65% to 0.76% for Berea oils versus VRo equivalent values of 0.71% to 0.82% as predicted from MPI.
 Figure 12. (A) Measured vitrinite reflectance (VRo in %) values versus methylphenanthrene index values (MPI; 1.5 × (3MP+2MP)/(P+9MP+1MP), where P is phenanthrene and MP is methylphenanthrene). (B) Saturate/aromatic ratio (Sat/Arom) for oils and solvent extracts as a function of VRo calculated from MPI. Modified from Parris et al. (2019) with permission of Kentucky Geological Survey. R2 = coefficient of determination.
Primary expulsion and migration of Berea oils from Devonian source rocks may explain why diasterane/sterane ratios are much higher in oils than in solvent extracts, with the larger more polar sterane molecule preferentially retained in the source bitumen (Peters et al., 1990). The oil sample collected farthest downdip (closest to a source kitchen) contains the lowest diasterane/sterane ratios, which may suggest it has migrated the shortest distance in Berea carrier beds, if all oil samples were generated from the same source at the same time. However, samples collected updip show no systematic increase in diasterane/sterane ratios and the two highest diasterane/sterane ratios correspond to absence of the C35 homohopane, suggesting a thermal maturity effect is present with the two highest thermal maturity oils containing the highest diasterane/sterane ratios. Partially corroborating this idea is that one of these two oil samples has the highest measured API value and the other appears to have lost light ends. Moreover, despite the strong contrast between diasterane/sterane ratios in oils and solvent extracts, no similar relationship is observed for tricyclic terpane/hopane ratios, which should show a corresponding primary migration relationship with hopanes retained in bitumens. Based on these observations, we suggest the oils collected from Jayne Heirs H1 and EQT 572356 may be slightly higher maturity than the other oil samples, even the most downdip EQT 572357. This is partially corroborated by VRo equivalent values calculated from MPI, which show a low value of 0.72% in the EQT 572357 oil. However, updip oils from ALC 20 and Torchlight 8 show higher VRo equivalent values from MPI than do the Jayne Heirs H1 and EQT 572356.
SUMMARY AND CONCLUSIONS
Berea oils in eastern Kentucky are of one family and all are from a similar source rock based on API gravity, sulfur, SARA fractions, n-alkane envelopes, C-isotopic compositions, sterane distributions, correlation between individual sterane and hopane concentrations, and similarity in extended hopane concentrations. Berea oils in eastern Kentucky are identical in C-isotopic composition to Berea-reservoired crude oils in eastern Ohio and dissimilar to oils reservoired in lower Paleozoic eastern Ohio strata. Berea oils and organic matter in the potential source rocks are from a marine source based on multiple proxies including Pr/Ph and terrestrial-to-aquatic ratios, CPI values, n-alkane maxima, C-isotopic composition, presence of tricyclic terpanes (from Tasmanites and/or bacterial biomass), and the positions of oil and extract samples in tricyclic terpane and hopane ratio discriminant plots. The data indicate any or all of the Devonian to Mississippian black shale source rocks studied herein could be potential source rocks for Berea oils. This conclusion is based on similarities in oil and solvent extract Pr/n-C17 and Ph/n-C18 ratios; sterane distributions (with the exception of high-maturity samples from EQT 504353); C-isotopic values (from Sunbury, Cleveland, and lower Huron); and sterane/hopane and tricyclic terpane ratios. Sterane isomerization ratios and C27 (Ts/Ts+Tm) hopanes can be used to predict thermal maturity in the Berea petroleum system and suggest oils formed at thermal maturities of approximately 0.7% to 0.9% VRo. A strong relationship between C27 (Ts/Ts+Tm) hopane ratios and diasterane/sterane ratios is consistent with oils and solvent extracts being from the same organic matter source. Sulfurization of organic matter may explain high S concentrations in some solvent extracts and may suggest generation of low-sulfur Berea oils occurred in the mid to peak oil window. Consistent with sterane isomerization ratios, VRo equivalent values from MPI suggest generation of Berea oils occurred at approximately 0.7%–0.9% VRo and allow prediction of saturate/aromatic ratios based on thermal maturity in the Berea petroleum system. Significant updip lateral migration of 30–50 mi from a downdip Devonian black shale source kitchen is required to emplace these low sulfur oils in the updip oil play areas in Lawrence and Greenup Counties. These results are consistent with previous studies of Devonian petroleum systems in the Appalachian Basin and show immature source rocks nearby to Berea oil production are not contributing to produced hydrocarbons.
REFERENCES CITED
Alshahrani, S., and J. E. Evans, 2014, Shallow-water origin of a Devonian black shale, Cleveland Shale Member (Ohio Shale), northeastern Ohio, USA: Open Journal of Geology, v. 4, no. 12, p. 636–653, doi:10.4236/ojg.2014.412048.
Andrusevich, V. E., M. H. Engel, and J. E. Zumberge, 2000, Effects of paleolatitude on the stable carbon isotope composition of crude oils: Geology, v. 28, no. 9, p. 847–850, doi:10.1130/0091-7613(2000)28<847:EOPOTS>2.0.CO;2.
ASTM International, 2012, D287-12b: Standard test method for API gravity of crude petroleum and petroleum products (hydrometer method): West Conshohocken, Pennsylvania, ASTM International, 5 p.
ASTM International, 2015, D7708: Standard test method for microscopical determination of the reflectance of vitrinite dispersed in sedimentary rocks: West Conshohocken, Pennsylvania, ASTM International, 10 p.
Azevedo, D. A., F. R. Aquino Neto, B. R. T. Simoneit, and A. C. Pinto, 1992, Novel series of tricyclic aromatic terpanes characterized in Tasmanian tasmanite: Organic Geochemistry, v. 18, no. 1, p. 9–16, doi:10.1016/0146-6380(92)90138-N.
Bechtel, A., U. Movsumova, J. Pross, R. Gratzer, S. Ćorić, and R. F. Sachsenhofer, 2014, The Oligocene Maikop series of Lahich (eastern Azerbaijan): Paleoenvironment and oil–source rock correlation: Organic Geochemistry, v. 71, p. 43–59, doi:10.1016/j.orggeochem.2014.04.005.
Blumer, M., R. R. L. Guillard, and T. Chase, 1971, Hydrocarbons of marine phytoplankton: Marine Biology, v. 8, no. 3, p. 183–189, doi:10.1007/BF00355214.
Bourbonniere, R. A., and P. A. Meyers, 1996, Sedimentary geolipid records of historical changes in the watersheds and productivities of Lakes Ontario and Erie: Limnology and Oceanography, v. 41, no. 2, p. 352–359, doi:10.4319/lo.1996.41.2.0352.
Cole, G. A., R. J. Drozd, R. A. Sedivy, and H. I. Halpern, 1987, Organic geochemistry and oil-source correlations, Paleozoic of Ohio: AAPG Bulletin, v. 71, no. 7, p. 788–809.
De Graaf, W., J. S. Sinninghe Damsté, and J. W. de Leeuw, 1992, Laboratory simulation of natural sulphurization: I. Formation of monomeric and oligomeric isoprenoid polysulphides by low-temperature reactions of inorganic polysulphides with phytol and phytadienes: Geochimica et Cosmochimica Acta, v. 56, no. 12, p. 4321–4328, doi:10.1016/0016-7037(92)90275-N.
Dembicki, H. Jr., 2009, Three common source rock evaluation errors made by geologists during prospect or play appraisals: AAPG Bulletin, v. 93, no. 3, p. 341–356, doi:10.1306/10230808076.
Dow, W. G., 1977, Kerogen studies and geological interpretations: Journal of Geochemical Exploration, v. 7, p. 79–99, doi:10.1016/0375-6742(77)90078-4.
East, J. A., C. S. Swezey, J. E. Repetski, and D. O. Hayba, 2012, Thermal maturity map of Devonian shale in the Illinois, Michigan, and Appalachian basins of North America: US Geological Survey Scientific Investigations Map 3214, 1 sheet, doi:10.3133/sim3214.
Eble, C. F., P. C. Hackley, T. M. Parris, and S. F. Greb, 2021, Organic petrology and geochemistry of the Sunbury and Ohio Shales in eastern Kentucky and southeastern Ohio: AAPG Bulletin, v. 105, no. 3, p. 493–515, doi:10.1306/09242019089.
Ekweozor, C. M., J. I. Okogun, D. E. U. Ekong, and J. M. Maxwell, 1979, Preliminary organic geochemical studies of samples from the Niger Delta (Nigeria). I. Analyses of crude oils for triterpanes: Chemical Geology, v. 27, no. 1-2, p. 11–28, doi:10.1016/0009-2541(79)90100-1.
El Diasty, W. S., S. Y. E. Beialy, K. E. Peters, H. El Afty, A. M. Gheith, and N. N. Agha, 2016, Organic geochemistry of crude oils and Upper Cretaceous source rocks from Concession II, West Sirte Basin, Libya: Journal of Petroleum Geology, v. 39, no. 4, p. 393–413, doi:10.1111/jpg.12659.
Ettensohn, F. R., 1985, Controls on development of Catskill Delta complex basin-facies, in Woodrow, D. L., and W. D. Sevon, eds., The Catskill Delta: Boulder, Colorado, Geological Society of America Special Paper 201, p. 65–78, doi:10.1130/SPE201-p65.
Ettensohn, F. R., 2004, Modeling the nature and development of major Paleozoic clastic wedges in the Appalachian Basin, USA: Journal of Geodynamics, v. 37, no. 3–5, p. 657–681, doi:10.1016/j.jog.2004.02.009.
Ettensohn, F. R., and T. D. Elam, 1985, Defining the nature and location of a Late Devonian-Early Mississippian pycnocline in eastern Kentucky: GSA Bulletin, v. 96, no. 10, p. 1313–1321, doi:10.1130/0016-7606(1985)96<1313:DTNALO>2.0.CO;2.
Ettensohn, F. R., M. L. Miller, S. B. Dillman, T. D. Elam, K. L. Geller, D. R. Swager, G. Markowitz, R. D. Woock, and L. S. Barron, 1988, Characterization and implications of the Devonian-Mississippian black shale sequence, eastern and central Kentucky, U.S.A.: Pycnoclines, transgression, regression, and tectonism, in McMillan, N. J., A. F. Embry, and D. J. Glass, eds., Devonian of the world: Proceedings of the 2nd International Symposium on the Devonian System: Calgary, Alberta, Canada, Canadian Society of Petroleum Geologists Memoir 14, v. 2, p. 323–345.
French, K. L., C. Hallmann, J. M. Hope, P. L. Schoon, J. A. Zumberge, Y. Hoshino, and C. A. Peters, et al., 2015, Reappraisal of hydrocarbon biomarkers in Archean rocks: Proceedings of the National Academy of Sciences of the United States of America, v. 112, no. 19, p. 5915–5920, doi:10.1073/pnas.1419563112.
GeoMark, 2015, Redbase-rock and fluid database, accessed October 27, 2020, http://geomarkresearch.com/database-products.
Grantham, P. J., and L. L. Wakefield, 1988, Variations in the sterane carbon number distributions of marine source rock derived crude oils through geological time: Organic Geochemistry, v. 12, no. 1, p. 61–73, doi:10.1016/0146-6380(88)90115-5.
Hackley, P. C., and M. D. Lewan, 2018, Understanding and distinguishing reflectance measurements of solid bitumen and vitrinite using hydrous pyrolysis: Implications to petroleum assessment: AAPG Bulletin, v. 102, no. 6, p. 1119–1140, doi:10.1306/08291717097.
Hackley, P. C., and R. T. Ryder, 2021, Organic geochemistry and petrology of Devonian shale in eastern Ohio: Implications for petroleum systems assessment: AAPG Bulletin, v. 105, no. 3, p. 543–573, doi:10.1306/08192019076.
Hackley, P. C., R. T. Ryder, M. H. Trippi, and H. Alimi, 2013, Thermal maturity of northern Appalachian Basin Devonian shales: Insights from sterane and terpane biomarkers: Fuel, v. 106, p. 455–462, doi:10.1016/j.fuel.2012.12.032.
Haddad, E. E., M. L. Tuite, A. M. Martinez, K. Williford, D. L. Boyer, M. L. Droser, and G. D. Love, 2016, Lipid biomarker stratigraphic records through the Late Devonian Frasnian/Famennian boundary: Comparison of high- and low-latitude epicontinental marine settings: Organic Geochemistry, v. 98, p. 38–53, doi:10.1016/j.orggeochem.2016.05.007.
Huang, H., S. Zhang, and J. Su, 2016, Palaeozoic oil–source correlation in the Tarim Basin, NW China: A review: Organic Geochemistry, v. 94, p. 32–46, doi:10.1016/j.orggeochem.2016.01.008.
Huang, W.-Y., and W. G. Meinschein, 1979, Sterols as ecological indicators: Geochimica et Cosmochimica Acta, v. 43, no. 5, p. 739–745, doi:10.1016/0016-7037(79)90257-6.
Hughes, W. B., A. G. Holba, and L. I. P. Dzou, 1995, The ratio of dibenzothiophene to phenanthrene and pristane to phytane as indicators of depositional environment and lithology of petroleum source rocks: Geochimica et Cosmochimica Acta, v. 59, no. 17, p. 3581–3598, doi:10.1016/0016-7037(95)00225-O.
Hunt, J. M., 1996, Petroleum geochemistry and geology: New York, W.H. Freeman and Company, 743 p.
Kara-Gülbay, R., and S. Korkmaz, 2012, Occurrences and origin of oils and asphaltites from South East Anatolia (Turkey): Implications from organic geochemistry: Journal of Petroleum Science Engineering, v. 90–91, p. 145–158, doi:10.1016/j.petrol.2012.04.014.
Kenig, F., J. S. Sinninghe Damsté, N. L. Frewin, J. M. Hayes, and J. W. De Leeuw, 1995, Molecular indicators for palaeoenvironmental change in a Messinian evaporitic sequence (Vena del Gesso, Italy). II: High-resolution variation in abundances and 13C contents of free and sulphur-bound carbon skeletons in a single marl bed: Organic Geochemistry, v. 23, no. 6, p. 485–526, doi:10.1016/0146-6380(95)00049-K.
Kepferle, R. C., 1993, A depositional model and basin analysis for gas-bearing black shale (Devonian and Mississippian) in the Appalachian Basin, in Roen, J. B., and R. C. Kepferle, eds., Petroleum geology of the Devonian and Mississippian black shale of eastern North America: Washington, DC, US Geological Survey Bulletin 1909, p. F1–F23.
Kodner, R. B., A. Pearson, R. E. Summons, and A. H. Knoll, 2008, Sterols in red and green algae: Quantification, phylogeny, and relevance for the interpretation of geologic steranes: Geobiology, v. 6, no. 4, p. 411–420, doi:10.1111/j.1472-4669.2008.00167.x.
Kohnen, M. E. L., J. S. Sinninghe Damsté, and J. W. De Leeuw, 1991, Biases from natural sulphurization in paleoenvironmental reconstruction based on hydrocarbon biomarker distributions: Nature, v. 349, no. 6312, p. 775–778, doi:10.1038/349775a0.
Korkmaz, S., R. Kara-Gülbay, and Y. H. İztan, 2013, Organic geochemistry of the Lower Cretaceous black shales and oil seep in the Sinop Basin, Northern Turkey: An oil–source rock correlation study: Marine and Petroleum Geology, v. 43, p. 272–283, doi:10.1016/j.marpetgeo.2013.02.003.
Köster, J., H. M. E. Van Kaam-Peters, M. E. Koopmans, J. W. De Leeuw, and J. S. Sinninghe Damsté, 1997, Sulphurization of homohopanoids: Effects on carbon number distribution, speciation and 22S/22R epimer ratios: Geochimica et Cosmochimica Acta, v. 61, no. 12, p. 2431–2452, doi:10.1016/S0016-7037(97)00110-5.
Kroon, J., and J. W. Castle, 2011, Biomarkers in the Upper Devonian Huron Shale as indicators of biological source of organic matter, depositional environment, and thermal maturity: AAPG Search and Discovery article 20117, accessed October 27, 2020, http://www.searchanddiscovery.com/pdfz/documents/2011/20117kroon/ndx_kroon.pdf.html.
Martinez, A. M., D. L. Boyer, M. L. Droser, C. Barrie, and G. D. Love, 2019, A stable and productive marine microbial community was sustained through the end-Devonian Hangenberg Crisis within the Cleveland Shale of the Appalachian Basin, United States: Geobiology, v. 17, no. 1, p. 27–42, doi:10.1111/gbi.12314.
Mashhadi, Z. S., and A. R. Rabbani, 2015, Organic geochemistry of crude oils and Cretaceous source rocks in the Iranian sector of the Persian Gulf: An oil–oil and oil–source rock correlation study: International Journal of Coal Geology, v. 146, p. 118–144, doi:10.1016/j.coal.2015.05.003.
McDowell, R. C., 1986, The geology of Kentucky: A text to accompany the geologic map of Kentucky: US Geological Survey Professional Paper 1151-H, p. H1–H76.
Mello, M. R., N. Telnaes, P. C. Gaglianone, M. I. Chicarelli, S. C. Brassell, and J. R. Maxwell, 1988, Organic geochemical characterization of depositional palaeoenvironments of source rocks and oils in Brazilian marginal basins: Organic Geochemistry, v. 13, no. 1-3, p. 31–45, doi:10.1016/0146-6380(88)90023-X.
Moldowan, J. M., F. J. Fago, C. Y. Lee, S. R. Jacobson, D. S. Watt, N.-E. Slougui, A. Jeganathan, and D. C. Young, 1990, Sedimentary 24-n-propylcholestane, molecular fossils diagnostic of marine algae: Science, v. 247, no. 4940, p. 309–312, doi:10.1126/science.247.4940.309.
Moldowan, J. M., P. Sundararaman, and M. Schoell, 1986, Sensitivity of biomarker properties to depositional environment and/or source input in the Lower Toarcian of SW Germany: Organic Geochemistry, v. 10, no. 4-6, p. 915–926, doi:10.1016/S0146-6380(86)80029-8.
Molyneux, S. G., W. L. Manger, and B. Owens, 1984, Preliminary account of Late Devonian palynomorph assemblages from the Bedford Shale and Berea Sandstone Formations of central Ohio, U.S.A.: Journal of Micropalaeontology, v. 3, no. 2, p. 41–51, doi:10.1144/jm.3.2.41.
Nuttall, B. C., 2016, Summary of publicly available production data for the Devonian Berea Sandstone play, eastern Kentucky: AAPG Search and Discovery article 10895, accessed October 27, 2020, http://www.searchanddiscovery.com/pdfz/documents/2016/10895nuttall/ndx_nuttall.pdf.html.
Ourisson, G., P. Albrecht, and M. Rohmer, 1982, Predictive microbial biochemistry—From molecular fossils to prokaryotic membranes: Trends in Biochemical Sciences, v. 7, no. 7, p. 236–239, doi:10.1016/0968-0004(82)90028-7.
Parris, T. M., S. F. Greb, C. F. Eble, P. C. Hackley, and D. C. Harris, 2019, Berea Sandstone petroleum system: Kentucky Geological Survey Contract Report 6, Series XIII, 342 p., accessed October 27, 2020, https://kgs.uky.edu/kgsweb/olops/pub/kgs/CNR6_13.pdf.
Parris, T. M., P. C. Hackley, S. F. Greb, and C. F. Eble, 2021, Molecular and isotopic gas composition of the Devonian Berea Sandstone and implications for gas evolution, eastern Kentucky: AAPG Bulletin, v. 105, no. 3, p. 575–595, doi:10.1306/10142019103.
Parris, T. M., and B. C. Nuttall, 2021, Berea Sandstone: New developments in a mature oil and gas play, eastern Kentucky and Ohio: AAPG Bulletin, v. 105, no. 3, p. 485–492, doi:10.1306/09242019246.
Pashin, J. C., and F. R. Ettensohn, 1987, An epeiric shelf-to-basin transition; Bedford-Berea Sequence, northeastern Kentucky and south-central Ohio: American Journal of Science, v. 287, no. 9, p. 893–926, doi:10.2475/ajs.287.9.893.
Pashin, J. C., and F. R. Ettensohn, 1992, Paleoecology and sedimentology of the dysaerobic Bedford fauna (Late Devonian), Ohio and Kentucky (USA): Palaeogeography, Palaeoclimatology, Palaeoecology, v. 91, no. 1–2, p. 21–34, doi:10.1016/0031-0182(92)90029-5.
Peters, K. E., and J. M. Moldowan, 1991, Effects of source, thermal maturity, and biodegradation on the distribution and isomerization of homohopanes in petroleum: Organic Geochemistry, v. 17, no. 1, p. 47–61, doi:10.1016/0146-6380(91)90039-M.
Peters, K. E., J. M. Moldovan, and P. Sundararaman, 1990, Effects of hydrous pyrolysis on biomarker thermal maturity parameters: Monterey Phosphatic and Siliceous members: Organic Geochemistry, v. 15, no. 3, p. 249–265, doi:10.1016/0146-6380(90)90003-I.
Peters, K. E., C. C. Walters, and J. M. Moldowan, 2005, The biomarker guide, volume 2: Biomarkers and isotopes in petroleum exploration and earth history: Cambridge, United Kingdom, Cambridge University Press, 704 p.
Radke, M., 1988, Application of aromatic compounds as maturity indicators in source rocks and crude oils: Marine and Petroleum Geology, v. 5, no. 3, p. 224–236, doi:10.1016/0264-8172(88)90003-7.
Radke, M., and D. H. Welte, 1983, The methylphenanthrene index (MPI): A maturity parameter based on aromatic hydrocarbons, in Bjorøy, M., C. Albrecht, and C. Cornford, eds., Advances in organic geochemistry 1981: Proceedings of the 10th International Meeting on Organic Geochemistry, University of Bergen, Norway, September 14–18, 1981: New York, John Wiley & Sons, p. 504–512.
Radke, M., D. H. Welte, and H. Willsch, 1986, Maturity parameters based on aromatic hydrocarbons: Influence of the organic matter type: Organic Geochemistry, v. 10, no. 1-3, p. 51–63, doi:10.1016/0146-6380(86)90008-2.
Repetski, J. E., R. T. Ryder, D. G. Weary, A. G. Harris, and M. H. Trippi, 2008, Thermal maturity patterns (CAI and %Ro) in Upper Ordovician and Upper Devonian rocks of the Appalachian Basin: A major revision of USGS Map I917-E using new subsurface collections: US Geological Survey Scientific Investigations Map 3006, accessed October 27, 2020, https://pubs.usgs.gov/sim/3006/.
Rimmer, S. M., D. J. Cantrell, and P. J. Gooding, 1993, Rock-Eval pyrolysis and vitrinite reflectance trends in the Cleveland Shale Member of the Ohio Shale, eastern Kentucky: Organic Geochemistry, v. 20, no. 6, p. 735–745, doi:10.1016/0146-6380(93)90058-J.
Ryder, R. T., P. C. Hackley, H. Alimi, and M. H. Trippi, 2013, Evaluation of thermal maturity in the low maturity Devonian shales of the northern Appalachian Basin: AAPG Search and Discovery article 10477, accessed October 27, 2020, http://www.searchanddiscovery.com/documents/2013/10477ryder/ndx_ryder.pdf.
Schwark, L., and P. Empt, 2006, Sterane biomarkers as indicators of Palaeozoic algal evolution and extinction events: Palaeogeography, Palaeoclimatology, Palaeoecology, v. 240, no. 1–2, p. 225–236, doi:10.1016/j.palaeo.2006.03.050.
Seifert, W. K., and J. M. Moldowan, 1978, Applications of steranes, terpanes and monoaromatics to the maturation, migration and source of crude oils: Geochimica et Cosmochimica Acta, v. 42, no. 1, p. 77–95, doi:10.1016/0016-7037(78)90219-3.
Seifert, W. K., and J. M. Moldowan, 1986, Use of biomarkers in petroleum exploration, in Johns, R. B., ed., Methods in geochemistry and geophysics: Amsterdam, Elsevier, v. 24, p. 261–290.
Shanmugam, G., 1985, Significance of coniferous rain forests and related organic matter in generating commercial quantities of oil, Gippsland Basin, Australia: AAPG Bulletin, v. 69, no. 8, p. 1241–1254.
Sinninghe Damsté, J. S., F. Kenig, M. P. Koopmans, J. Köster, S. Schouten, J. M. Hayes, and J. W. de Leeuw, 1995, Evidence for gammacerane as an indicator of water column stratification: Geochimica et Cosmochimica Acta, v. 59, no. 9, p. 1895–1900, doi:10.1016/0016-7037(95)00073-9.
Słowakiewicz, M., M. Blumenberg, D. Więcław, H.-G. Röhling, G. Scheeder, K. Hindenberg, and A. Leśniak, et al., 2018, Zechstein Main Dolomite oil characteristics in the Southern Permian Basin: I. Polish and German sectors: Marine and Petroleum Geology, v. 93, p. 356–375, doi:10.1016/j.marpetgeo.2018.03.023.
Sofer, Z., 1984, Stable carbon isotope compositions of crude oils: Application to source depositional environments and petroleum alteration: AAPG Bulletin, v. 68, no. 1, p. 31–49.
Stahl, W. J., 1978, Source rock-crude oil correlation by isotopic type-curves: Geochimica et Cosmochimica Acta, v. 42, no. 10, p. 1573–1577, doi:10.1016/0016-7037(78)90027-3.
Tankard, A. J., 1986, Depositional response to foreland deformation in the Carboniferous of eastern Kentucky: AAPG Bulletin, v. 70, no. 7, p. 853–868.
Volkman, J. K., 1986, A review of sterol markers for marine and terrigenous organic matter: Organic Geochemistry, v. 9, no. 2, p. 83–99, doi:10.1016/0146-6380(86)90089-6.
Waples, D. W., and T. Machihara, 1991, Biomarkers for geologists: A practical guide to the application of steranes and triterpanes in petroleum geology: AAPG Methods in Exploration Series, no. 9, 91 p.
Zhang, S., and H. Huang, 2005, Geochemistry of Palaeozoic marine petroleum from the Tarim Basin, NW China: Part 1. Oil family classification: Organic Geochemistry, v. 36, no. 8, p. 1204–1214, doi:10.1016/j.orggeochem.2005.01.013.
AUTHORS
Paul C. Hackley is a research geologist at USGS in Reston, Virginia, where he oversees the Organic Petrology Laboratory. He holds degrees from Shippensburg University (B.A.), George Washington University (M.Sc.), and George Mason University (Ph.D.). His primary research interests are in organic petrology and its application to fossil fuel assessment.
Thomas M. (Marty) Parris is a research geologist at KGS, University of Kentucky, where he uses gas and aqueous fluid geochemistry to conduct research on petroleum systems, basin fluid flow, diagenesis, and the environmental impacts of energy development. He received his Ph.D. from the University of California, Santa Barbara, and B.S. degree from Tennessee Tech University.
Cortland F. Eble is a geologist with KGS, University of Kentucky, who specializes in Paleozoic palynology, organic petrology, and coal and petroleum source rock geochemistry. He received his B.S. from Auburn University and M.S. and Ph.D. from West Virginia University.
Stephen F. Greb has been a geologist for KGS, University of Kentucky, for more than 30 years. Steve has researched various aspects of Appalachian and Illinois Basin geology, including sedimentology, coal geology, carbon storage, and basin analysis. He received his B.S. degree at the University of Illinois Urbana–Champaign and his master’s degree and Ph.D. from the University of Kentucky.
David C. Harris is a geologist and head of the Energy and Minerals Section at KGS, University of Kentucky. He has worked at KGS since 1990 and worked previously for BP Exploration and Mobil. He has an M.S. degree from Stony Brook University and B.S. degree from the College of William & Mary.
ACKNOWLEDGMENTS
Reviews by Paul Lillis, Katherine French (USGS), and two anonymous journal reviewers and comments from AAPG Editor Robert K. Merrill improved this paper. Alex Zumberge (GeoMark Research, Ltd.) helped with technical questions related to geochemical analysis. This research was funded by the Berea Sandstone Petroleum System Consortium in collaboration with the USGS Energy Resources Program under Technical Assistance Agreement No. 14MWTAAGGEMN458. All data used in the paper are contained in the included tables. Any use of trade, firm, or product names is for descriptive purposes only and does not imply endorsement by the US Government.
DATASHARE 128
Figures S1–S4 and Table S1 are available in an electronic version on the AAPG website (www.aapg.org/datashare) as Datashare 128.