The AAPG/Datapages Combined Publications Database
Environmental Geosciences (DEG)
Figure
Environmental Geosciences (DEG); Year: 2019; Issue: September DOI: 10.1306/eg.02271918009
Return to Full Text
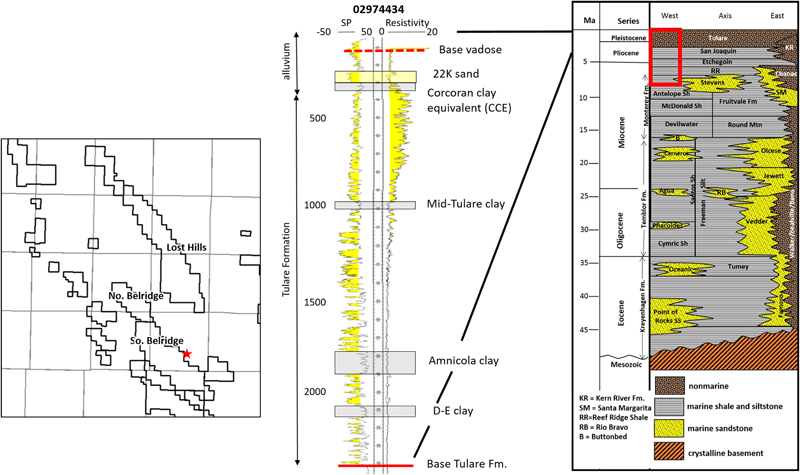
Figure 2. Type log (API 0402974434 shown by red star on inset map) of the alluvium and Tulare Formation in the study area. Yellow shading on spontaneous potential (SP) curve indicates sand bodies in the aquifer. Yellow shading on resistivity curve indicates resistivity greater than 3 ohm m. Major confining clays are shown in gray. Depth values in feet. Stratigraphic column of the southern San Joaquin Valley is shown on the right, with formations addressed in this study highlighted in red. Modified from Scheirer and Magoon (2007). Fm. = Formation; Mtn. = Mountain; No. = North; Sh. = Shale; So. = South.
Figure 2. Type log (API 0402974434 shown by red star on inset map) of the alluvium and Tulare Formation in the study area. Yellow shading on spontaneous potential (SP) curve indicates sand bodies in the aquifer. Yellow shading on resistivity curve indicates resistivity greater than 3 ohm m. Major confining clays are shown in gray. Depth values in feet. Stratigraphic column of the southern San Joaquin Valley is shown on the right, with formations addressed in this study highlighted in red. Modified from Scheirer and Magoon (2007). Fm. = Formation; Mtn. = Mountain; No. = North; Sh. = Shale; So. = South.