The AAPG/Datapages Combined Publications Database
Environmental Geosciences (DEG)
Figure
Environmental Geosciences (DEG); Year: 2019; Issue: September DOI: 10.1306/eg.02271918009
Return to Full Text
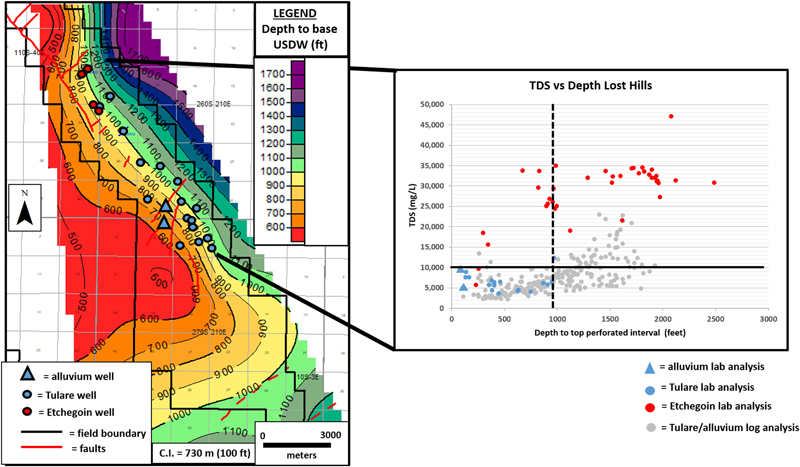
Figure 8. Graph of total dissolved solids (TDS) versus depth of geochemical samples from the Tulare and alluvium (blue) and Etchegoin (red) formations in and near the Lost Hills oil field. Gray dots represent TDS calculated from geophysical logs in the field. The horizontal red line marks 10,000 mg/L and the vertical dashed red line marks the approximate depth of the deepest underground sources of drinking water (USDW) sample. The adjacent map shows the location of the Tulare and alluvium wells sampled as blue dots and shallow (<150 m [500 ft] deep) Etchegoin samples as red dots (deeper Etchegoin sample sites are not shown on map) and the contours to base USDW from log analysis. Lost Hills is the only area that contains brackish water in the Etchegoin Formation. However, the brackish waters in the Etchegoin occur in an oil-producing zone that is steam flooded so it is considered to be an exempt aquifer and is not protected. C.I. = contour interval.
Figure 8. Graph of total dissolved solids (TDS) versus depth of geochemical samples from the Tulare and alluvium (blue) and Etchegoin (red) formations in and near the Lost Hills oil field. Gray dots represent TDS calculated from geophysical logs in the field. The horizontal red line marks 10,000 mg/L and the vertical dashed red line marks the approximate depth of the deepest underground sources of drinking water (USDW) sample. The adjacent map shows the location of the Tulare and alluvium wells sampled as blue dots and shallow (<150 m [500 ft] deep) Etchegoin samples as red dots (deeper Etchegoin sample sites are not shown on map) and the contours to base USDW from log analysis. Lost Hills is the only area that contains brackish water in the Etchegoin Formation. However, the brackish waters in the Etchegoin occur in an oil-producing zone that is steam flooded so it is considered to be an exempt aquifer and is not protected. C.I. = contour interval.