The AAPG/Datapages Combined Publications Database
Environmental Geosciences (DEG)
Figure
Environmental Geosciences (DEG); Year: 2020; Issue: September DOI: 10.1306/eg.01222019023
Return to Full Text
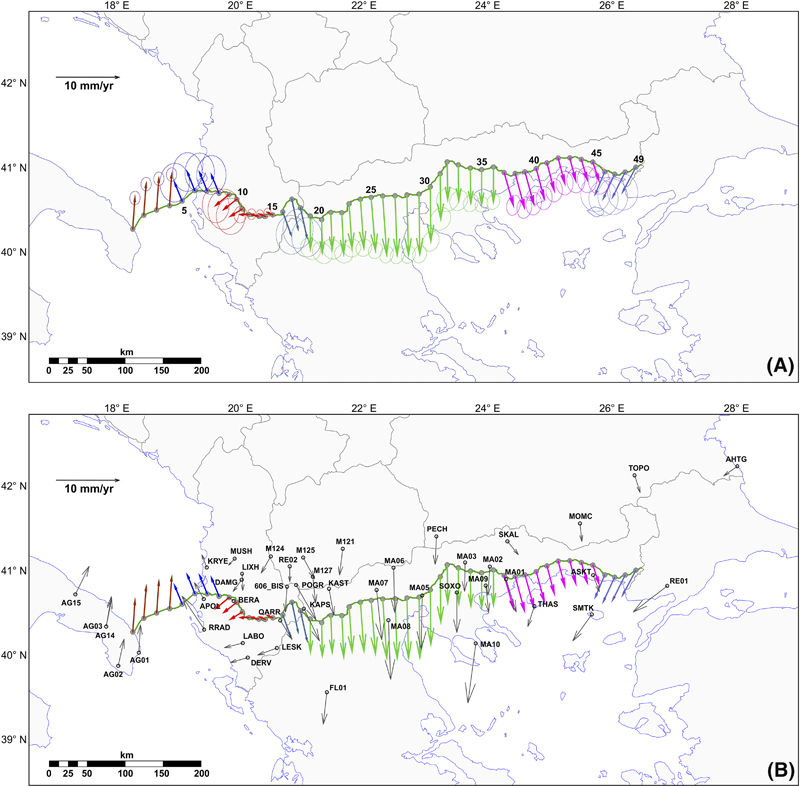
Figure 7. (A) Horizontal velocities (colored arrows) and corresponding estimated errors (colored ellipses) interpolated at equally spaced points along the Southern Gas Corridor–Trans Adriatic Pipeline route (green line) based on the blocky approach (the points belonging to each of the blocks of Figure 6 are indicated with the same color: brown [block 1]; blue [block 2]; red [block 3]; dark green [block 4]; green [block 5]; magenta [block 6]; violet [block 7]). (B) The same map with the original data (gray arrows and ellipses) for reference. Black labels are global navigation satellite system station names. Additional labels are informational references: AG = from D’Agostino et al. (2008, 2011); FL = from Floyd et al. (2010); M = Kotzev et al. (2006); MA = Matev (2011); RE = from Reilinger et al. (2006).
Figure 7. (A) Horizontal velocities (colored arrows) and corresponding estimated errors (colored ellipses) interpolated at equally spaced points along the Southern Gas Corridor–Trans Adriatic Pipeline route (green line) based on the blocky approach (the points belonging to each of the blocks of Figure 6 are indicated with the same color: brown [block 1]; blue [block 2]; red [block 3]; dark green [block 4]; green [block 5]; magenta [block 6]; violet [block 7]). (B) The same map with the original data (gray arrows and ellipses) for reference. Black labels are global navigation satellite system station names. Additional labels are informational references: AG = from D’Agostino et al. (2008, 2011); FL = from Floyd et al. (2010); M = Kotzev et al. (2006); MA = Matev (2011); RE = from Reilinger et al. (2006).