About This Item
- Full TextFull Text(subscription required)
- Pay-Per-View PurchasePay-Per-View
Purchase Options Explain
Share This Item
The AAPG/Datapages Combined Publications Database
Saskatchewan Geological Society
Abstract
C. Uranium Deposit Studies and Exploration Techniques,
Application of Reflectance Spectrometry to Assessment of Alteration Mineralogy at the Key Lake Uranium Deposit, Saskatchewan
Steven Earle
Grasswood Geoscience Ltd., 696 Western Acres Road, Nanaimo, BC V9R 5W9
Ken Wheatley
Uranerz Exploration and Mining Limited, 1300 Saskatoon Square, 410-22nd Street East, Saskatoon, SK S7K 5T6
Ken Wasyliuk
Cameco Corporation, 122 - 3rd Avenue North, Saskatoon, SK S7K 2H6
Near-infrared reflectance spectrometry data have been acquired for 339 core samples from the vicinity of the Deilmann deposit at Key Lake, northern Saskatchewan. The data have been used to estimate the proportions of the alteration minerals illite, chlorite, dickite, kaolinite, and dravite.
The results generally confirm those ofprevious studies which show dravitization of the sandstone directly above the Deilmann deposit and intense kaolinitization over a width of approximately 400 m. The kaolinite zone is flanked by strong illitization of the sandstone. The basement rocks in the immediate deposit area are strongly chloritized and illitized.
Unlike the methods used in previous studies, reflectance spectrometry allows for a distinction to be made between the kaolin minerals kaolinite and dickite. This study clearly demonstrates that kaolinite is the dominant sandstone clay mineral in the immediate vicinity of the Deilmann deposit. In areas outside of the alteration halo at Key Lake, dickite and illite are the predominant clay minerals. In contrast to suggestions made by other authors, it is argued that the kaolinite within the sandstone is an important and diagnostic feature of Key Lake-type uranium mineralization.
This work has shown that reflectance spectrometry is well suited to clay mineral studies within the Athabasca Basin. The technique provides more specific mineralogical information than geochemical estimation of clays, and is faster and much less expensive than X-ray diffraction. A very significant advantage of reflectance spectrometry is that it provides immediate results, which can be followed up directly with additional sampling.
Near-infrared reflectance spectrometry has been used to identify clay minerals and to estimate clay mineral proportions in sandstone and basement rocks in the area around the Deilmann uranium deposit at Key Lake, situated approximately 600 km north of Saskatoon, Saskatchewan, at the southeastern edge of the Helikian Athabasca Basin (Figure 1). The objective of this study is to demonstrate the applicability of reflectance spectrometry to alteration mineral studies in the vicinity of unconformity-type uranium deposits.
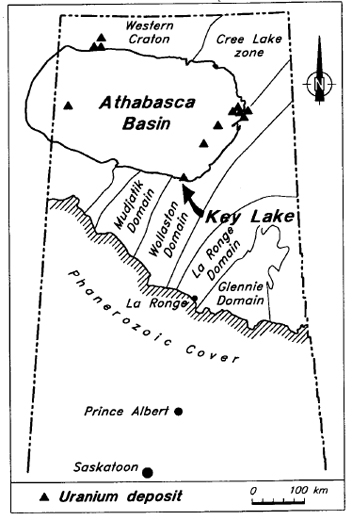 Figure 1 - Location of the Key Lake deposit in northern Saskatchewan.
The sampling program was focussed on the eastern end of the Deilmann deposit, where the sandstone thickness is consistently in the range of 50 to 75 m. Nearly half of the samples were collected from a mineralized section in the northeastern part of the deposit. The sample locations are described in more detail below.
The geological features of the Key Lake deposits are summarized by Kirchner et al. (1980). The deposits are hosted by pelitic metasediments of Aphebian age, and by the overlying Helikian Athabasca Group sandstone (Figure 2). In this area, the Athabasca Group rocks comprise the lowermost members of the Manitou Falls Formation, which consist of fine- to coarse-grained quartz arenites with conglomerate beds and suspended quartz pebbles (Ramaekers, 1990). The principal uranium minerals at Key Lake are pitchblende and coffmite. The age of primary mineralization is estimated at 1350 ±4 Ma (Carl et al., 1992), although there is evidence of post-depositional remobilization of uranium at various times between 89 and 370 Ma (Kirchner et al., 1980).
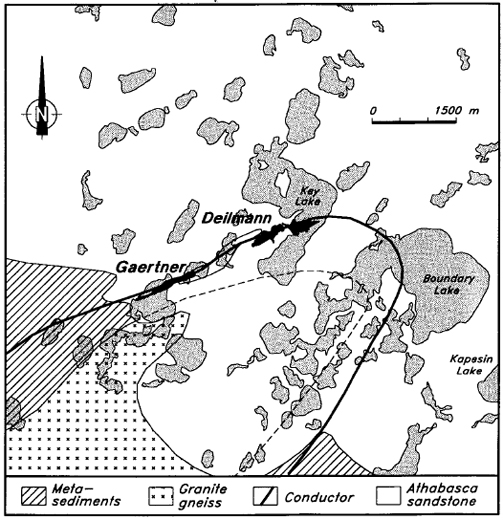 Figure 2 - Generalized geological features of the Key Lake area.
Previous Work
Numerous studies have been directed towards determining the clay mineral characteristics of the sandstone and basement rocks in the Key Lake area. On the basis of X-ray diffraction (XRD) analysis, Hoeve (1982) noted that there is a very extensive illite alteration zone surrounding the Key Lake deposits. He suggested that it formed at the time of uranium mineralization under conditions of deep burial and high-grade diagenesis. Hoeve outlined a kaolinitization halo directly over the orebody, and suggested that this feature was probably associated with the 300 to 250 Ma remobilization of the sandstone-hosted uranium mineralization. He implied that this event was related to uplift and erosion, and was also responsible for fault-controlled kaolinitization in other parts of the basin. Hoeve asserted that kaolinite is not diagnostic of the mineralizing process, and has no direct value as an ore guide, although it may be useful for outlining faults. In the basement, Hoeve (1982) recognized that the kaolinite-rich upper paleo-weathering zone is interrupted in the vicinity of mineralization by the conversion of kaolinite to illite and chlorite.
Following several years of mapping and petrographic work within the Gaertner deposit pit at Key Lake, Ruhrmann (1986) concluded that the extensive illitization was associated with the initial phase of uranium mineralization. He observed dravitization within kaolinitic zones and replacement of illite by kaolinite and chlorite, which he related to a subsequent event. Ruhrmann also presented evidence of a later illite overprint.
Based on a petrographic study, Hubregtse (1987) stated that the earliest hydrothermal alteration event in the Key Lake area was kaolinitization of the sandstone, and that this was followed by dravitization, and then by widespread illitization, but that the illitization did not affect the earlier kaolinitic and silicic rocks immediately above the orebody. He suggested that all of these events preceded the main uranium mineralization event and stated categorically that there is no kaolinite in the younger alteration assemblage or in the late cross-faults.
In the summary of a project based on stable isotope analysis, Wilson and Kyser (1987) suggested that illitization of the sandstone and illitization and chloritization of the basement were coincident with uranium mineralization. They proposed that conversion of sandstone illite and chlorite to kaolinite above the ore zone resulted from a much later low-temperature interaction with surface waters.
Ramaekers (1989) carried out a petrographic and geochemical study of sandstone samples from the Deilmann deposit pit and concluded that: 1) diagenetic kaolinite and illite were derived through recrystallization and alteration of original detrital kaolinite; 2) illite, dravite, and chlorite were formed under hydrothermal conditions prior to uranium deposition; and 3) hydrothermal kaolinite was formed after uranium deposition.
The relative timing of selected alteration events in the Key Lake area, taken from the five papers summarized above, is given in Figure 3. The only definitive conclusion which can be drawn from this summary is that there is very little consensus amongst these authors as to the timing and significance of events which have affected the sandstone and basement at Key Lake.
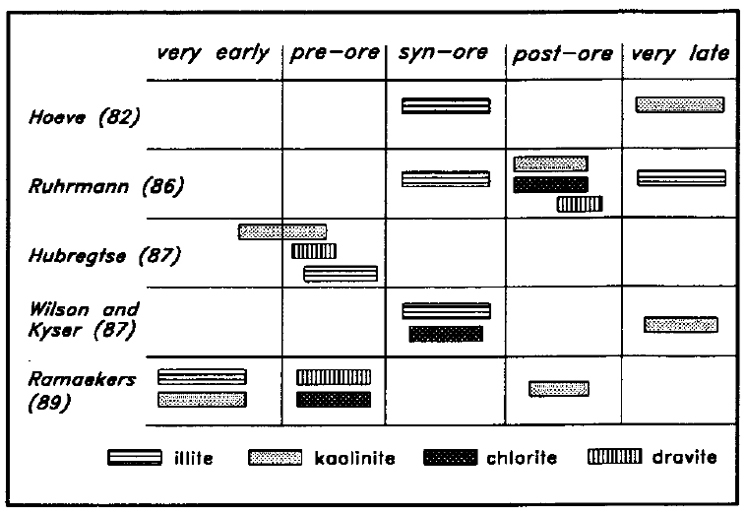 Figure 3 - Summary of the relative timing of Key Lake alteration events, based on previous studies.
Reflectance Spectrometry
The application of near-infrared or short-wave infrared reflectance spectrometry to mineral identification has been summarized by Hunt (1977) and by Clark et al. (1990). Visible and near-infrared spectra for several minerals are shown in Figure 4. The 1300 to 2500 nm spectral range of the PIMA II instrument used in this study is indicated.
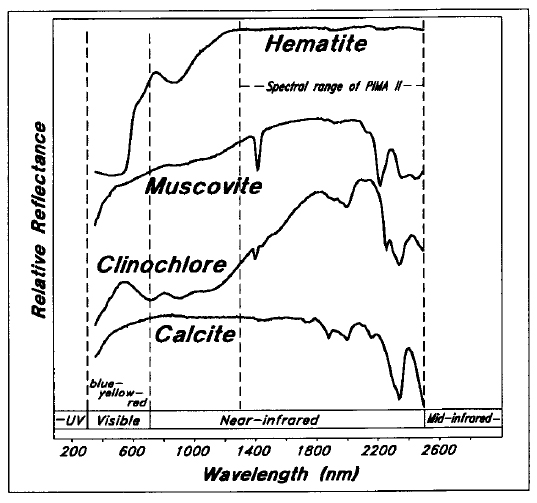 Figure 4 - Visible and near-infrared spectra for selected minerals (data from U.S. Geol. Survey).
Hematite shows strong absorption of blue and yellow visible light and significant absorption in the immediate near-infrared, but has no significant peaks in the range of the PIMA II. Muscovite is characterized by well-defined absorption peaks at 1400 and 2200 nm, related to stretching vibrations of Al-OH bonds. The chlorite mineral clinochlore also has absorption at approximately 1400 and 2200 nm, but has very strong absorption at 2350 nm, related to stretching vibrations of Mg-OH bonds. Calcite also shows very strong absorption at approximately 2350 nm resulting from stretching and bending in the CO3-1 ion, but shows no significant absorption at either 1400 or 2200 nm. Minerals such as quartz and feldspar have no well-defined absorption peaks in the visible and near-infrared ranges.
Near-infrared reflectance spectra for some representative samples from the Key Lake area are shown in Figures 5 to 8. Illite, like muscovite, has very well-defined absorption peaks at 1410 nm and 2200 nm (Figure 5). Illite also shows varying degrees of broad absorption at around 1900 nm, due to the presence of structural water.
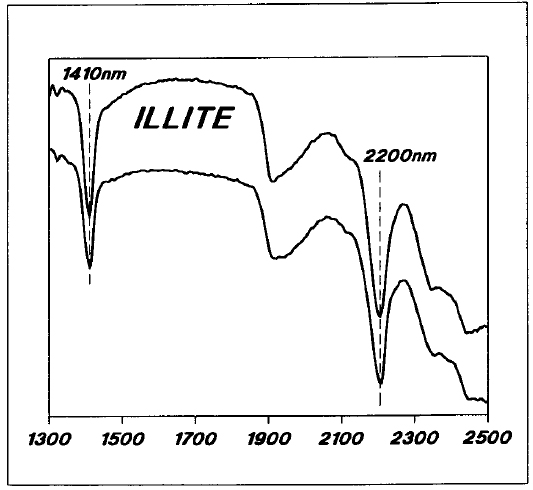 Figure 5 - Reflectance spectra for typical Key Lake area illitic samples.
Kaolinite and dickite also have strong absorption in the 1400 and 2200 nm regions, but both minerals have distinctive double peaks at both locations (Figure 6), because their Al-OH bonds exist in two different configurations with respect to the tetrahedral and octahedral layers. In kaolinite, the 1400 nm peaks are relatively close together while the 2200 nm peaks are farther apart. In dickite, the 1400 nm peaks are far apart, while the 2200 nm peaks are relatively close together¹.
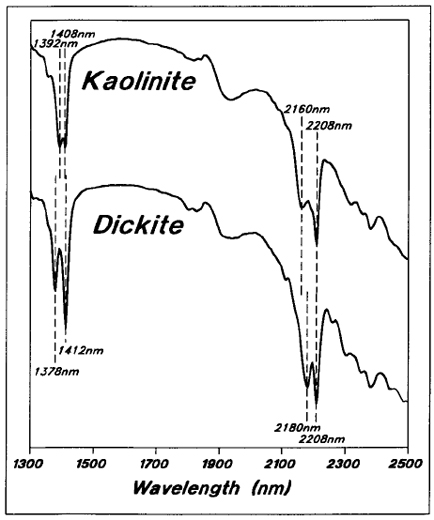 Figure 6 - Reflectance spectra for typical Key Lake area kaolinitic and dickitic samples.
Most of the chlorite within the sandstone and upper basement rocks in the Athabasca Basin area is the di-trioctahedral variety sudoite (cf. Hoeve et al., 1981), which has absorption peaks at 1400, 2210, 2250, and 2340 nm (Figure 7). The 2250 and 2340 nm peaks are derived from Mg-OH vibrations in the trioctahedral layer, while the 2210 nm peak is derived from Al-OH vibrations in the dioctahedral layer.
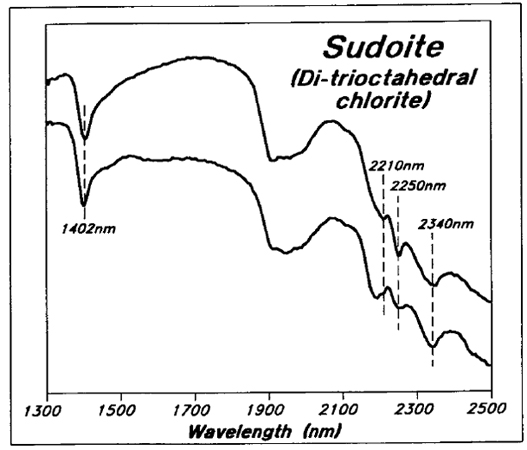 Figure 7 - Reflectance spectra for typical Key Lake area chloritic samples.
Dravite has distinctive Mg-OH absorption peaks at close to 2244 and 2364 nm, and also at 1438 nm (Figure 8).
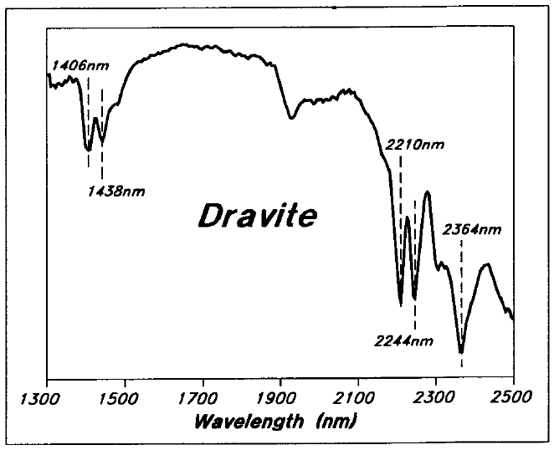 Figure 8 - Reflectance spectra for a typical Key Lake area dravitic sample.
Sample Collection
A total of 339 core samples were collected and analyzed. The collar locations of the 35 holes sampled are shown on Figure 9. The 13 "background" holes are situated 1000 to 3000 m from the Gaertner and Deilmann deposits. They were chosen either because they have no geochemical or geological indications of mineralization, or because they were drilled for engineering purposes in areas which are not geologically favourable for uranium mineralization.
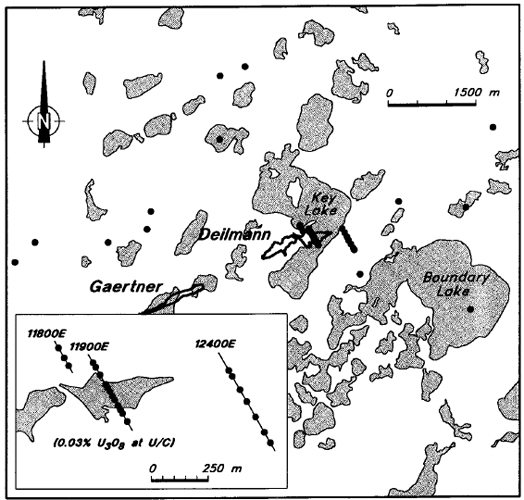 Figure 9 - Collar locations for drill holes sampled in this study.
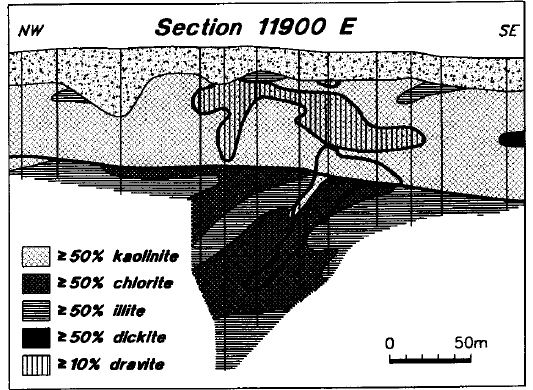
Seven holes were sampled along the unmineralized line 12400 E (inset map, Figure 9), which intersects the Deilmann structural trend some 300 m east of the end of the orebody. The main graphitic horizon was encountered in the basement rocks in two of the holes at the northwestern end of this line. Thirteen holes were sampled along line 11900 E, which intersects the main part of the Deilmann deposit, and an additional three holes were sampled to the north of the mineralized zone on line 11800 E.
In most holes, single-chip samples were collected at approximately 5 or 10 m intervals within the sandstone, and one or two samples were collected in the basement within 15 m of the unconformity. In some of the holes on lines 11900 E and 12400 E, additional basement samples were collected at 10 m intervals, to a maximum depth of 110 m below the unconformity. The sample locations on line 11900 E are shown on Figure 10. The sample sizes are variable, but on average comprise 2 to 4 cm of core.
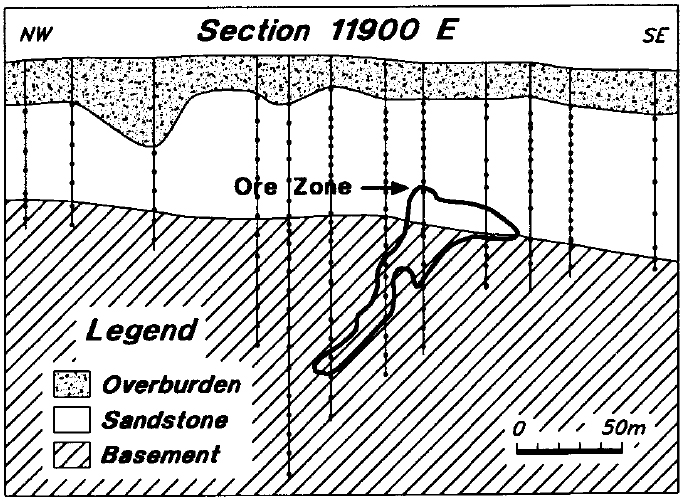 Figure 10 - Core sample locations on line 11900 E.
Analysis
Prior to acquisition of spectral data, all samples were heated in a microwave oven to drive off excess moisture. Groups of five samples were heated for five minutes at full power.
Reflectance spectra in the range 1300 to 2500 nm were acquired using an Integrated Spectronics PIMA-II spectrometer. The spectral resolution ranges from 6 to 10 nm and the sampling interval is 2 nm. The instrument is equipped with an internal halogen light source and the sample window is a 2 mm by 10 mm rectangle.
For most samples, spectra were obtained from a recently broken surface (neither parallel to the bedding nor along a visible fracture or vein), and also from the rounded surface of the core. In a vast majority of cases, results from the two surface types agree very closely, although the fresh surfaces usually provide more clearly defined spectra than the cored surfaces, which have been exposed to surface conditions for up to 20 years and commonly have traces of drilling fluid.
Data Processing
Mineral proportions were estimated using the MINSPEC algorithm, a computer program developed by the senior author. The algorithm is based on spectral results from Athabasca Group samples for which the clay mineral proportions have been determined using other techniques, such as geochemical analysis and XRD. The MINSPEC algorithm uses peak-height ratios and slopes of the spectral curves within specific wavelength ranges to estimate clay mineral proportions. This technique is effective for samples from the Athabasca Basin because only a limited number of reflectance- visible phases - illite, chlorite, dickite, kaolinite, and dravite - are commonly present. The spectra were also interpreted qualitatively to ensure that the MINSPEC estimates were reasonable.
As an example, spectra for a series of samples with varying proportions of illite and dickite are shown in Figure 11. Looking at the 1400 nm peak area, it is evident that there is a single symmetrical peak in the case of 100 percent illite. At 13 percent dickite, this peak has become asymmetrical, while at 45 percent dickite there is a distinctive second peak at 1378 nm. As the dickite proportion increases further, the height of the 1378 nm peak increase's relative to that of the 1412 nm peak.
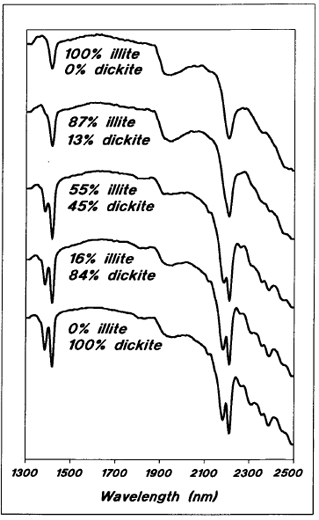 Figure 11 - Reflectance spectra for samples with varying proportions of illite and dickite.
The mineral proportion results are presented on cross- sections along line 11900 E, and on maps of the general Key Lake area. On the maps, the values for each hole are based on the average mineral proportion values for that hole. For illite, kaolinite, dickite, and dravite, only the sandstone samples are included in the average values. For chlorite, which is virtually absent from the sandstone, only the basement samples are included.
There is very strong dravitization of the sandstone directly above the deposit (Figure 12). In several of these samples, more than 30 percent of the matrix of the sandstone is dravite. Background dravite levels are consistently low in the general Key Lake area, as only the holes in the central part of line 11900 E show detectable dravite (Figure 13). Although there are minor amounts of detrital dravite throughout the Manitou Falls Formation (Ramaekers, 1990), the regional dravite background is also very low.
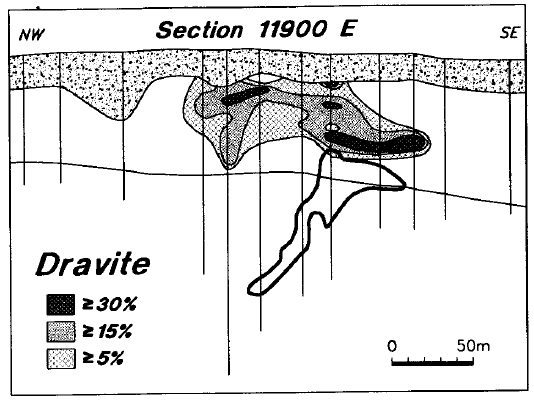 Figure 12 - Distribution of dravite in line 11900 E.
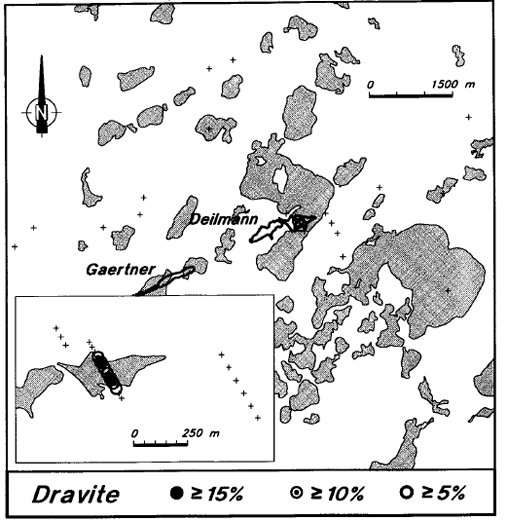 Figure 13 - Average levels of dravite in the sandstone of Key Lake area drill holes.
Kaolinite is also uncommon within the Manitou Falls Formation in the eastern part of the Athabasca Basin, but there is very intense kaolinitization of the sandstone overlying the deposit (Figure 14). Most of the samples from this section have at least 75 percent kaolinite in the clay fraction, and many have over 90 percent kaolinite. Some basement samples from within the ore zone are also kaolinitic. Kaolinite is generally absent from the unmineralized areas at Key Lake, although some of the holes along strike from the Deilmann deposit have moderately high kaolinite levels, and one hole, located about 300 m from known mineralization, is strongly kaolinitic (Figure 15). This hole is situated in an area which has not been extensively explored.
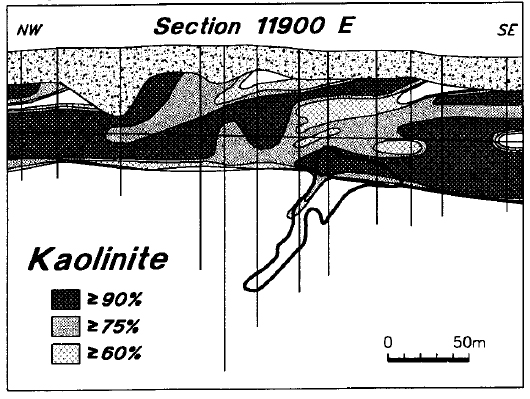 Figure 14 - Distribution of kaolinite in line 11900 E.
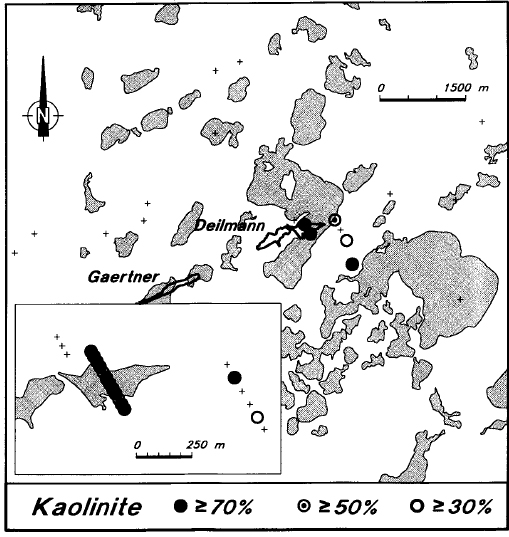 Figure 15 - Average levels of kaolinite in the sandstone of Key Lake area drill holes.
Chlorite levels are consistently low in the Manitou Falls Formation, and there is virtually no chlorite in the sandstone at Key Lake (Figure 16). Chlorite is commonly present in the Aphebian basement rocks below the Athabasca Basin, but there is little or no chlorite in the basement rocks immediately surrounding the deposit. On the other hand, there is strong chloritization of the basement rocks on line 11900 E, adjacent to and up-dip from the ore (Figure 16). These features are also evident on the map presentation (Figure 17). Chlorite is present in holes within and adjacent to the ore zone, is absent from holes immediately surrounding the deposit, and is present in some of the background holes.
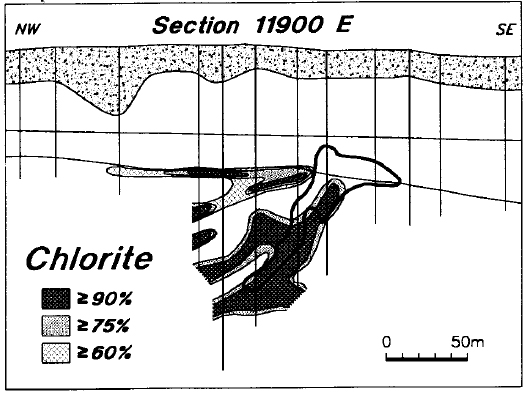 Figure 16 - Distribution of chlorite in line 11900 E.
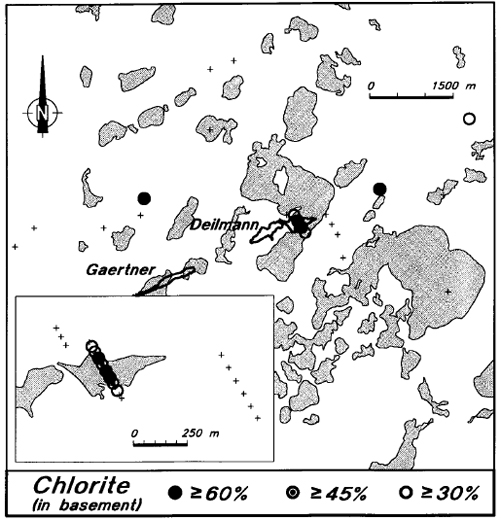 Figure 17 - Average levels of chlorite in the basement rocks of Key Lake area drill holes.
Illite is near ubiquitous in the matrix of Manitou Falls Formation sandstone, but is normally less abundant than the kaolin minerals (Earle and Sopuck, 1989). It is virtually absent from the sandstone directly above the deposit, although it is widely present in the basement rocks (Figure 18). Illite is consistently present in the sandstone of the holes adjacent to the deposit, and in the regional holes of this area (Figure 19). In many of these holes, the average illite levels are above 50 percent, which is higher than typical background levels in the Manitou Falls Formation.
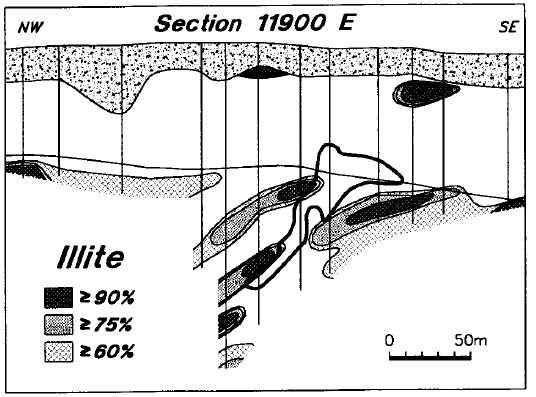 Figure 18 - Distribution of illite in line 11900 E.
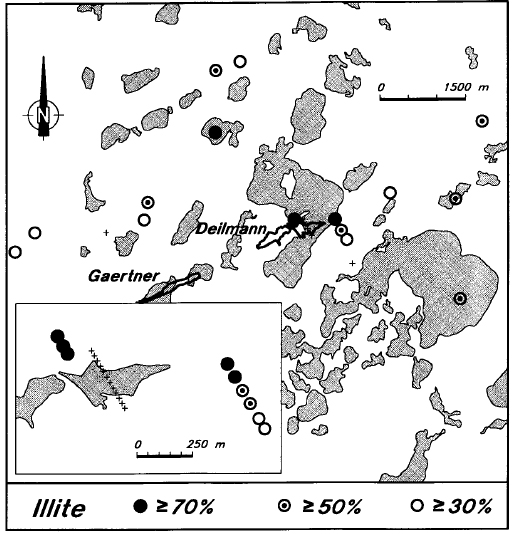 Figure 19 - Average levels of illite in the sandstone of Key Lake area drill holes.
There is very little dickite in the sandstone above the deposit (Figure 20), or in adjacent holes (Figure 21). On the other hand, regional background levels of dickite are high. Previous XRD and lithogeochemical studies have shown that kaolin minerals comprise >50 percent of the sandstone matrix throughout the eastern part of the basin (Hoeve et al., 1981; Earle and Sopuck, 1989). Other unpublished reflectance studies carried out by the authors have shown that, in most cases, this regional kaolin is dickite.
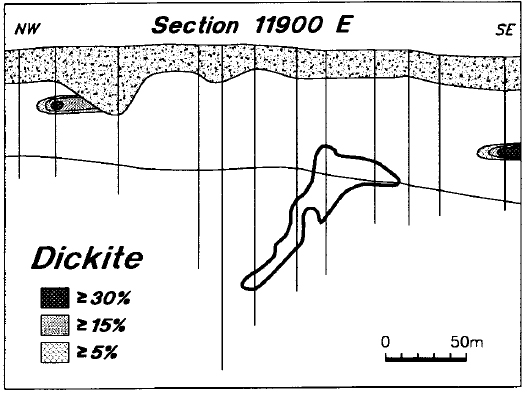 Figure 20 - Distribution of dickite in line 11900 E.
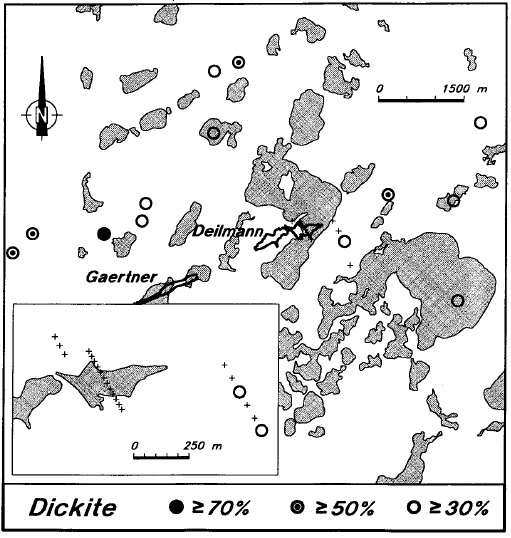 Figure 21 - Average levels of dickite in the sandstone of Key Lake area drill holes.
Figure 22 is a simplified synthesis of the alteration observed in the area of the Deilmann deposit, as determined using reflectance spectrometry. The zone of sandstone dravitization, which has a width of approximately 100 m at the subcrop on mineralized line 11900 E, shows the closest spatial association with the mineralization. It broadly coincides with the zone of most intense boron enrichment as defined by Earle and Sopuck (1989). The sandstone above the ore zone is intensely and consistently kaolinitized throughout the 60 to 80 m of preserved section, and across a width of approximately 350 m. Throughout much of this altered zone, kaolinite and dravite are virtually the only clay minerals present within the sandstone, and kaolinite is strongly dominant over dravite.
In all but one of the "background" holes in the Key Lake area, the sandstone matrix contains roughly equal amounts of illite and dickite. The exception is a hole situated to the east of the Deilmann deposit, which is entirely kaolinitic.
In non-mineralized areas at Key Lake, the clay fractions of most basement samples are dominated by illite or kaolinite. In the vicinity of mineralization (on line 11900 E), the upper basement rocks are commonly either strongly chloritized (>75 percent chlorite in the clay fraction) or strongly illitic. The zone of chloritization and illitization in basement rocks extends across a width of approximately 400 m. Strong illitization or chloritization is also recognized at depth in the mineralized drill holes.
Kaolin Minerals
Although the kaolin minerals dickite and kaolinite cannot be distinguished chemically, petrographically, or easily by X-ray diffractometry, these phases are clearly and easily distinguished using reflectance spectrometry. The results of this study outline the actual distribution of kaolinite and dickite for the first time at Key Lake. It is evident that the kaolin represented by the intense kaolinite enrichment around the ore zone is entirely different from the dickitic kaolin which is widely present in the non-mineralized sandstone of the eastern part of the basin.
According to Dunnoyer de Segonzac (1970), dickite is commonly developed under conditions of deep burial at variable but generally elevated temperatures (ca. 200°C), and from solutions with low levels of magnesium and potassium. This depth (or temperature) dependency is confirmed in studies of oilfield sandstones, such as those of Ehrenberg et al. (1993) and Morad et al. (1994). Kaolinite is also commonly developed either in an acidic weathering environment, or under acidic hydrothermal conditions from solutions with low magnesium and potassium contents.
It is suggested that the kaolin minerals observed in the Key Lake area were formed in at least three separate environments, and at different times, as follows:
- The kaolinite of the upper basement regolith was produced in an acidic weathering environment prior to deposition of the Athabasca Group.
- The dickite of the Athabasca sandstone in non- mineralized areas was produced by alteration of pre-existing detrital kaolinite during deep burial diagenesis (>1000 m) at elevated temperatures. The kaolinite of the regolith was probably not significantly affected by this process because of the low permeability of these clay-rich rocks (cf. Kantorowicz, 1985).
The kaolinite in the sandstone above the mineralized zone was produced under acidic hydrothermal conditions through transformation of pre-existing illite and dickite. As summarized above, some authors have suggested that the kaolinite alteration at Key Lake is derived from late (ca. 300 Ma) meteoric waters, and that it is unrelated to the uranium mineralization. We have looked for evidence of a direct spatial relationship between kaolinite and uranium mineralization, and while there is no longer any ore-grade uranium left in the core racks at Key Lake, there is significant uranium mineralization in some recently discovered mineralized zones along strike from the Deilmann and Gaertner deposits. One of these is the BV zone, situated some 4 km southwest of the Gaertner deposit.
The BV zone consists of high-grade uranium mineralization situated at the unconformity beneath approximately 15 m of sandstone. As shown in Figure 23, the sandstone at BV is consistently and strongly kaolinitic. The mineralized sample at 36 m is also kaolinitic, although the spectrum is poor due to the presence of pitchblende, as is the basement sample underneath the mineralized zone.
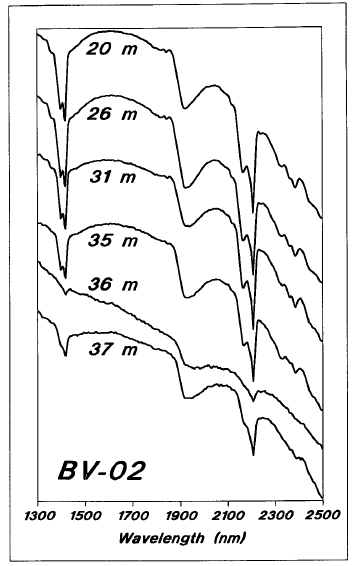 Figure 23 - Reflectance spectra for kaolinite samples from BV zone drill hole BV-02.
We feel that the kaolinite alteration in the Key Lake area is significant, and is an important and diagnostic indicator of the potential for uranium mineralization in this region. Although there is no definitive information on the timing of the kaolinitization, if this alteration is to be dismissed as being unimportant, then it is necessary to first explain the following features:
- There is a consistent and unique spatial relationship between kaolinite and uranium mineralization in the Key Lake area.
- The kaolinitization appears to be a result of alteration by ascending rather than descending fluids. At the Deilmann deposit, for example, the only non-kaolinitic rocks are at the top of the section.
- It does not appear likely that the kaolinitization could have been produced by relatively oxidizing meteoric waters, since there are several situations, such as at the BV zone, where kaolinite is in direct contact with unoxidized pitchblende mineralization.
Chlorite
Both regional- and deposit-scale studies of the eastern part of the Athabasca Basin have shown that the most common chlorite mineral in the Manitou Falls Formation is the di-trioctahedral polymorph sudoite (Hoeve et al., 1981; Hoeve, 1982; Percival and Kodoma, 1989). Sudoite was only recognized and described in the 1950s (Sudo et al., 1954), but is now considered common in a number of different environments, including:
- hydrothermally altered rhyolite, tuff, pegmatite, and arkose (Fransolet and Bourguignon, 1978),
- the alteration zones of Kuroko-type deposits (Shirozu etal., 1971),
- quartz-veined shales and slates (Fransolet and Bourguignon, 1978),
- low-grade metapelites (Theye and Siedel, 1993), and
- fluviatile sandstones affected by diagenesis (Fuchtbauer, 1974).
There is relatively little chloritization of the sandstone above the Deilmann deposit, but there is very strong chloritization of the basement rocks within about 100 m of the ore. In many of the samples from within this zone, chlorite ranges between 75 and 100 percent of the clay mineral fraction. Although there is not enough background data to confirm that this level of chlorite is a significant exploration parameter at depth in the basement, it appears to be highly significant in the upper paleoweathered basement rocks, which, in non-mineralized areas, are generally kaolinitic or illitic, and only weakly chloritic.
Illite
There is strong sandstone illitization associated with the Deilmann deposit, but the illitic rocks are only present at the edges of the kaolinite anomaly, and thus are situated 100 m or more away from the ore body.
There are several possible explanations for this distribution:
- illite initially present in the sandstone immediately above the mineralization may have been replaced by late kaolinite, as suggested by Hoeve (1982);
- the nature of the kaolinitized sandstone may have prevented illitization within this zone, as suggested by Hubregtse (1987); or
- illitization may only have taken place at the margin of the alteration halo.
Reflectance spectrometry has been used to determine the clay mineralogy of 339 sandstone and basement core samples from the Deilmann deposit and from elsewhere at Key Lake. It has been shown that this technique is very well suited for clay mineral alteration studies in this environment. Reflectance spectrometry provides immediate results with more specific mineralogical information than geochemical estimation, and at a much lower cost than XRD.
The reflectance data have generally confirmed the patterns of alteration at Key Lake, as outlined earlier from XRD, geochemical, and petrographic studies. The sandstone directly above the mineralized zone is characterized by a well-defined dravite anomaly and by an intense kaolinite anomaly which extends up to 200 m on either side of the deposit. This is flanked by a strong illite anomaly in the sandstone. Beyond the illitio zone, the sandstone is characterized by illite and dickite in roughly equal proportions. The basement rocks in the vicinity of the Deilmann deposit have been strongly chloritized (largely sudoite) even within the normally kaolinitic paleoweathered zone.
One of the primary advantages of reflectance spectrometry over both XRD and geochemistry is that it allows unequivocal differentiation between the kaolin minerals dickite and kaolinite. This has allowed a clear distinction between the hydrothermal kaolinite spatially associated with the mineralization at Key Lake and the diagenetic dickite, which is a regional feature of the Key Lake area and of much of the rest of the eastern Athabasca Basin. The intense kaolinitization of the sandstone is interpreted as a significant feature of the mineralization, and is an important exploration criterion in this part of the basin. Another important advantage of reflectance spectrometry is that it can be used in a field-camp setting, and hence the results can be available immediately to guide follow-up exploration.
We are grateful to Cameco Corporation and Uranerz Exploration and Mining Limited for funding this study, and for their permission to publish the results. The staff of the Key Lake Mine provided logistical support at the mine site. The drafting was completed by Cathy Haider of Uranerz and Wally Harildstad of Cameco.
Carl, C., von Pechmann, E., Hoehndorf, F., and Ruhrmann, G. (1992): Mineralogy and U/Pb, Pb/Pb and Sm/Nd geochronology of the Key Lake uranium deposit, Athabasca Basin, Saskatchewan, Canada; Can. J. Earth Sci., v29, p879-895.
Clark, R., King, T., Klejwa, M., and Swayze, G. (1990): High spectral resolution reflectance spectroscopy of minerals; J. Geophys. Resear., v95, p12653-12680.
Dunnoyer de Segonzac, G. (1970): The transformation of clay minerals during diagenesis and low-grade metamorphism: A review; Sedimentology, v15, p281-346.
Earle, S. and Sopuck, V. (1989): Regional lithogeochemistry of the eastern part of the Athabasca Basin uranium province, Saskatchewan; in Muller-Kahle, E. (ed.), Uranium Resources and Geology of North America, International Atomic Energy Agency, TECDOC-500, p263-269.
Ehrenberg, S., Aagaard, P., Wilson, M., Fraser, A., and Duthie, D. (1993): Depth-dependant transformation of kaolinite to dickite in sandstones of the Norwegian continental shelf; Clay Minerals, v28, p325-352.
Fransolet, A. and Bourguignon, P. (1978): Di/trioctahedral chlorite in quartz veins from the Ardenne, Belgium; Can. Mineral., v16, p365-373.
Fuchtbauer, H. (1974): Zur diagenese fluviatiler sandsteine; Geol. Rundsch., v63, p904-925.
Hoeve, J. (1982): Clay mineral host-rock alteration at the Key Lake uranium deposit, northern Saskatchewan; confidential report for Key Lake Mining Corporation, Sask. Resear. Counc., Publ. G645-7-C-82.
Hoeve, J., Rawsthorae, K., and Quirt, D. (1981): Uranium metallogenic studies: Clay mineral stratigraphy and diagenesis on the Athabasca Group; in Summary of Investigations 1981, Saskatchewan Geological Survey, Sask. Miner. Resour., Misc. Rep. 81-4, p76-89.
Hubregtse, J. (1987): Comparative petrographic study of the paragenetic and structural development of uranium mineralizations in the eastern Athabasca district; confidential report for Saskatchewan Mining Development Corporation.
Hunt, G. (1977): Spectral signatures of particulate minerals in the visible and near infrared; Geophys., v42, p501-513.
Kantorowicz, J. (1985): The petrology and diagenesis of Middle Jurassic clastic sediments, Ravenscar Group, Yorkshire; Sedimentology, v32, p833- 853.
Kirchner, G., Lehnert-Thiel, K., Rich, J., and Strnad, J. (1980): The Key Lake U-Ni deposits: A model for lower Proterozoic uranium deposition; in Ferguson, J. and Goleby, A. (eds.), Uranium in the Pine Creek Geosyncline, International Atomic Energy Agency, p617-629.
Morad, S., Ben Ismail, H., De Ros, L., Al-Aasm, I., and Serrhini, N-E. (1994): Diagenesis and formation water chemistry of Triassic reservoir sandstones from southern Tunisia; Sedimentology, v41, p1253-1272.
Percival, J. and Kodoma, H. (1989): Sudoite from Cigar Lake, Saskatchewan; Can. Mineral., v27, p633-641.
Ramaekers, P. (1989): Deilmann pit sandstone petrographic and geochemical study, 1988-1989; confidential report for Key Lake Mining Corporation.
___ (1990): Geology of the Athabasca Group (Helikian) in northern Saskatchewan; Sask. Energy Mines, Rep. 195, 49p.
Ruhrmann, G. (1986): The Gaertner uranium orebody at Key Lake (northern Saskatchewan, Canada) after three years of mining: An update of the geology; in Gilboy, C. and Vigrass, L. (eds.) Economic Minerals of Saskatchewan, Sask. Geol. Soc., Spec. Publ. 8, p120-137.
Shirozu, H., Ozaki, M., and Higashi, S. (1971): An interstratified mineral of mica-chlorite (sericite- sudoite) from the Matsumine Deposit of the Hanaoka Mine, Akita Prefecture, Japan; Clay Sci., v4, p45-52.
Sudo, T., Takahashi, H., and Matsui, H. (1954): On X- ray properties of the fire-clay from the Kurata Mine, Yamaguchi Prefecture; Jap. J. Geol. Geog., v42, p71-85.
Theye, T. and Siedel, H. (1993): Chloritoid, carpholite, and sudoite in very low-grade metamorphic rocks of Wippra Metamorphic Zone (Harz, Germany); Neues Jahrbuch fur Mineralogie Monatshefte, v9, p603-614.
Wilson, M. and Kyser, T. (1987): Stable isotope geochemistry of alteration associated with the Key Lake Uranium Deposit, Canada; Econ. Geol., v82, p1540-1557.
View the First Page
A text abstract of this article is not available. The first page of the PDF appears below.
You may download the first page as a PDF.

Pay-Per-View Purchase Options
The article is available through a document delivery service. Explain these Purchase Options.
| Watermarked PDF Document: $14 | |
| Open PDF Document: $24 |