About This Item
- Full TextFull Text(subscription required)
- Pay-Per-View PurchasePay-Per-View
Purchase Options Explain
Share This Item
The AAPG/Datapages Combined Publications Database
Williston Basin Symposium
Abstract
EXTENDED ABSTRACT: Horizontal Well Potential of the Lower Alida Beds at Handsworth Pool, Southeast Saskatchewan
J.H.Lakel and S. Seifert2
1 Lake Geological Services Inc. Swift Current, Sask.
2 Talisman Energy Inc., Suite 3400, 888 Third Street S.W., Calgary, Alberta
The Handsworth Pool produces light oil from limestones of the Lower Alida Beds (Landa Beds in U.S. terminology) in Township 10, Ranges 6 & 7 West of Second Meridian in southeast Saskatchewan. The pool was discovered in 1964 and had I l0 producing vertical wells prior to horizontal well development in 1993. Vertical well production declined from 1000 bopd in 1966 to 250 bopd in 1987. New vertical well drilling in 1989 brought production back to 700 bopd. Horizontal well drilling began in 1993 and by 1996, 121 horizontal wells had increased production to 7000 bopd. Hence the horizontal wells account for 56oh of total produced oil and have been producing since 1993 (10 years). As of February 11, 2003, Handsworth pool has produced 2,213,2422 Mcf of gas, 13,371,143 Bbl of oil and 114,000,000 Bbl of water. An efficient infrastructure with associated water disposal facilities combined with the drilling of horizontal wells greatly increased oil production and considerably enhanced the ultimate recoverable reserves of the pool.
Saskatchewan Industry and Resources list initial oil in place as 10.486 MM m³/65.96 MMbbls and ultimate primary recovery as22.8% (SEM Misc. Rept. 98-1). The pool covers 2412ha and has a net pay of 7.89m. The Lower Alida reservoir is at an average depth of 1204m and has an average porosity of 11.3% with an average water saturation of 35%. The produced oil has a density of 886 kg/m³ and a gravity of 28.2 API and reservoir temperature is 51°C.
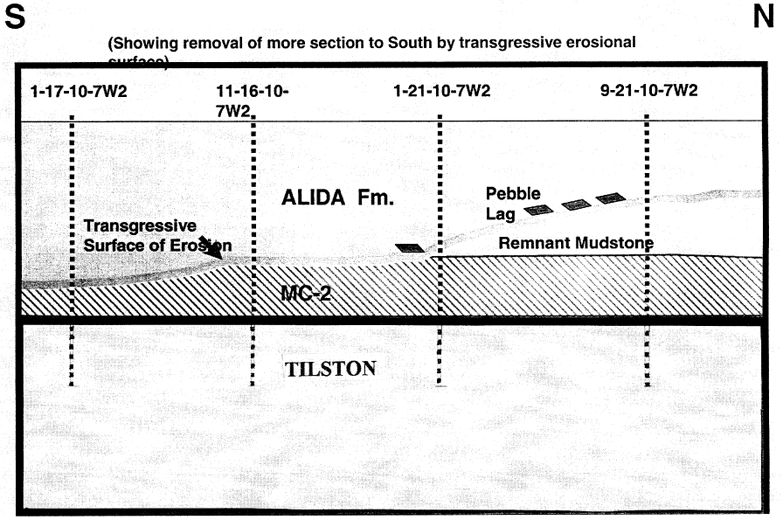
The index map shows the location of vertical and horizontal wells and the subcrop trapping edge of the Lower Alida along the pool's northern margin. The Lower Alida produces from a stacked sequence of crinoid-rich limestones. A major transgressive surface of erosion is recognized cutting across the base of the Alida Beds. This surface is delineated by a transgressive pebble lag in the northern-most cores on display. A three meter thick peritidal mudstone is preserved in the northern- most 11-21-10-7W2M core. This interval sits unconformably on the MC-2 exposure surface. The Lower Alida peritidal mudstones remain as unaltered limestones, whereas the MC-2 is dolomitized.
The transgressive surface of erosion removes progressively more section in a southerly direction, and half of the MC-2 interval is missing at the 1-17-10-7W2M location. The MC-2 also changes facies from a dolomitized evaporitic argillaceous mudstone in the northern three cores to a Glossifungites Ichnofacies burrowed surface in the 1 - 17 core. We are fortunate enough to view the transition from MC-2 exposure/hiatus to Glossifungites in these cores.
The crinoid-rich reservoir limestones onlap the Transgressive Surface of Erosion in this pool. The Transgressive Surface of Erosion acts as the reservoir bottom seal (base). Oil is trapped by thickening of the mudstone facies in an up dip direction. The crinoidal facies reservoir zero edge is hence ultimately controlled by the Sequence Boundary.
Of interest is the similarity of the electrical log responses in the Alida across the Transgressive Surface of Erosion. This error in correlation emphasizes the importance of facies correlation with diamond cores.
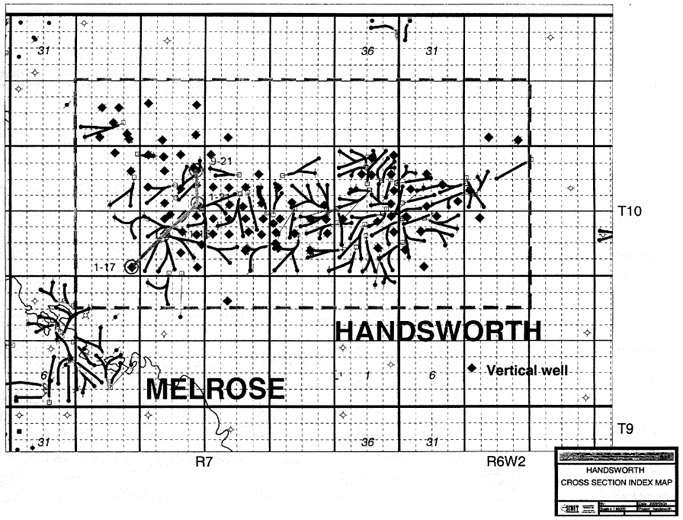 Index map for cross sections and well locations, Handsworth Pool, southeast Saskatchewan.
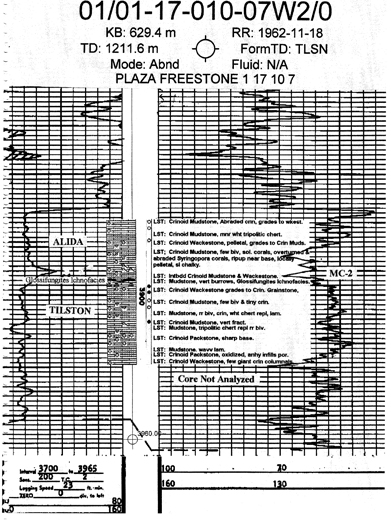
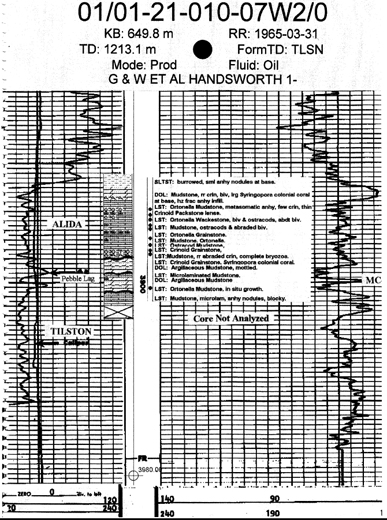 Well log of interval of interest and core description, G&W et al., Handsworth 1-, 1-21-10-7W2M.
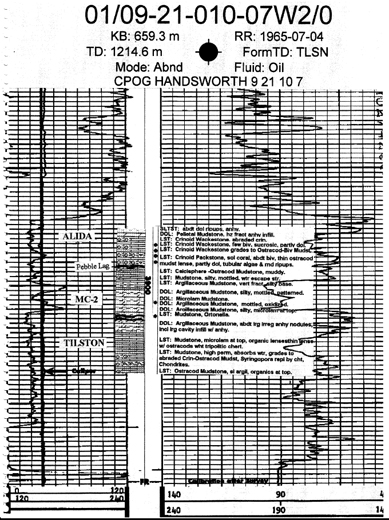 Well log of interval of interest and core description, CPOG Handsworth 9 21 10 7, 9-21-10-72M.
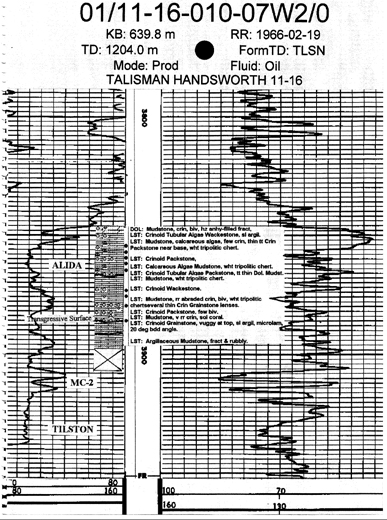
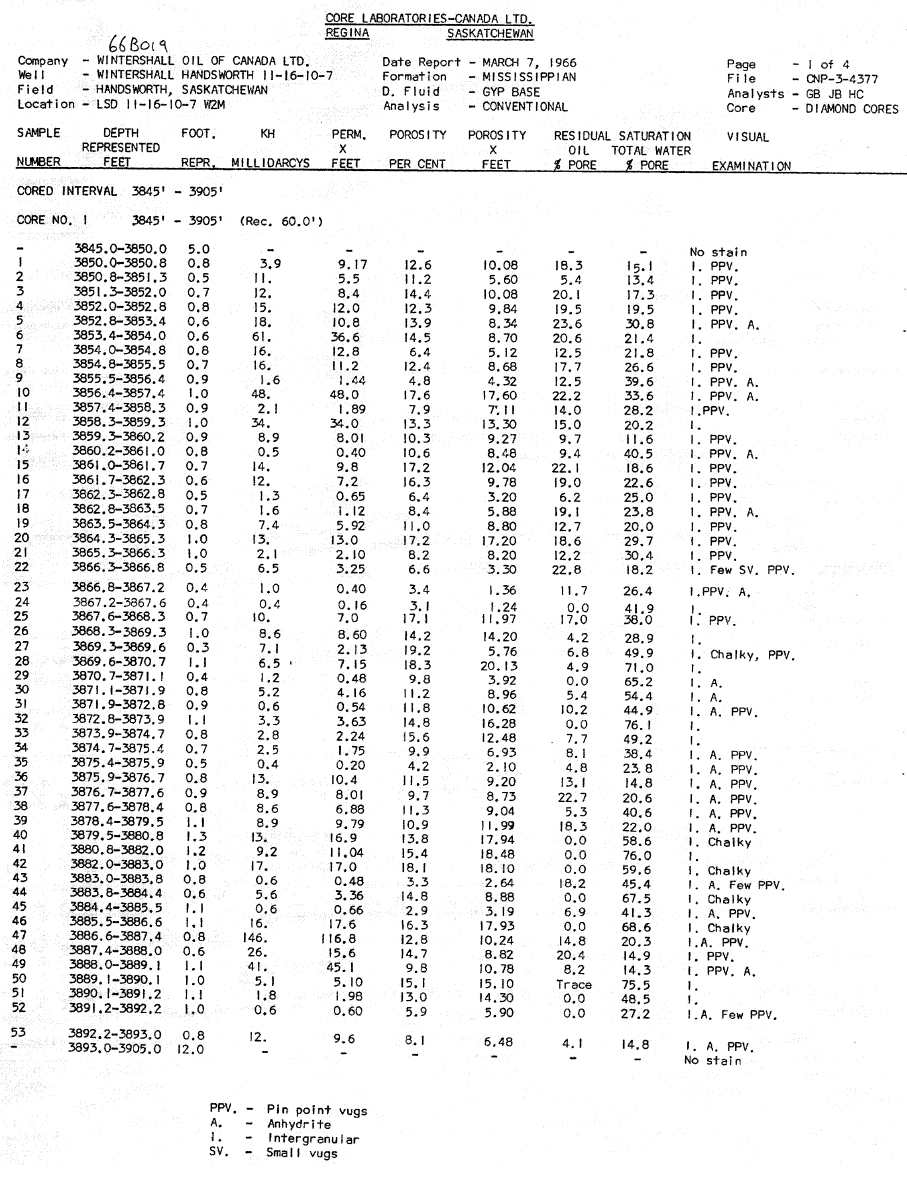 Core analysis, 3845-3866 ft, Wintershall Handsworth 11-16-10-7.
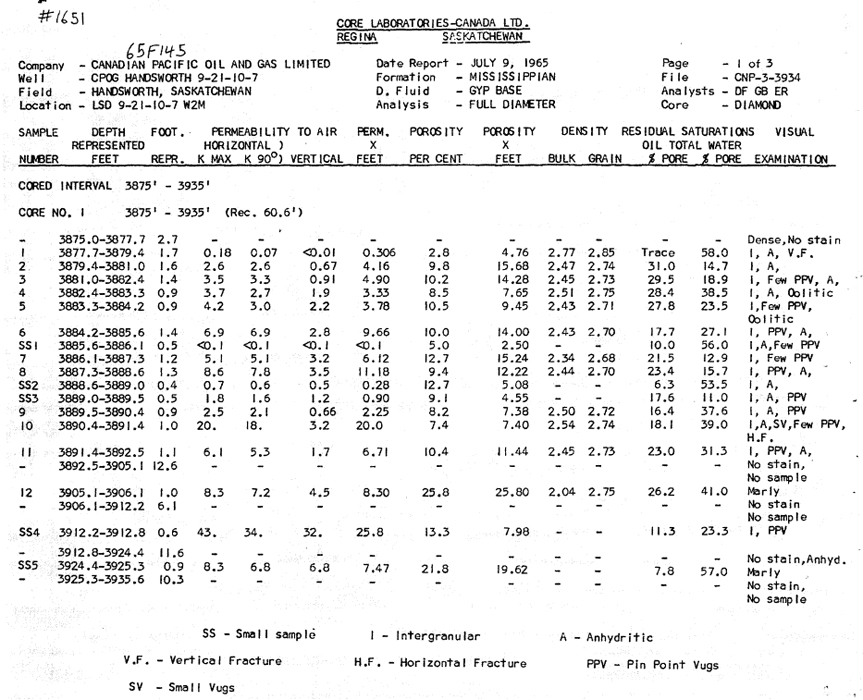 Core analysis, 3875-3912 ft, CPOG Handsworth 9-21-10-7
 Core-gamma correlation log, CPOG Handsworth 9-21-10-7.
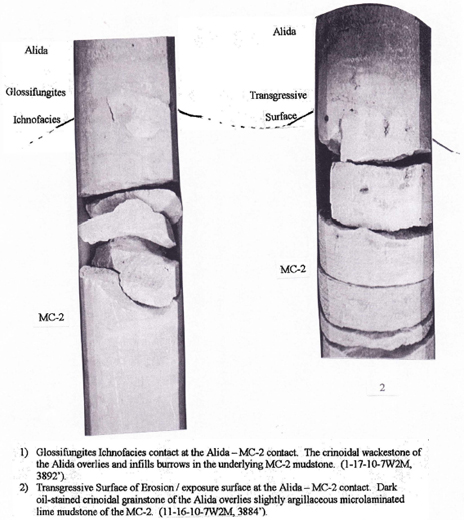 Alida -MC-2 contact in cores from two wells (1-17-10-7 [left] and 11-16-10-7 [right]).
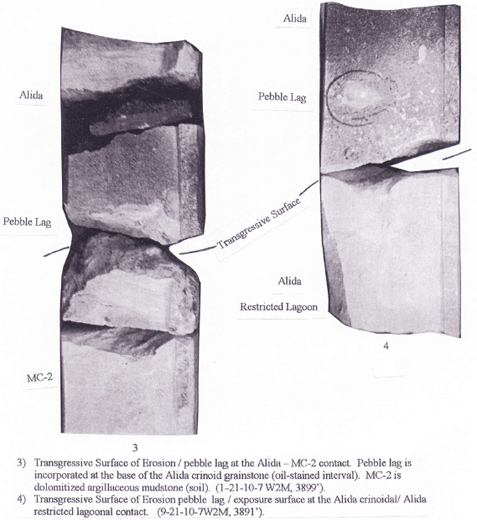 Alida-MC-2 contact in cores from two wells (1-21-10-7 [left] and 9-21-10-7 [right]).
 Another view of Alida-MC-2 contact in 9-21-10-7.
 Plot of total production from all wells, Handsworth Pool.
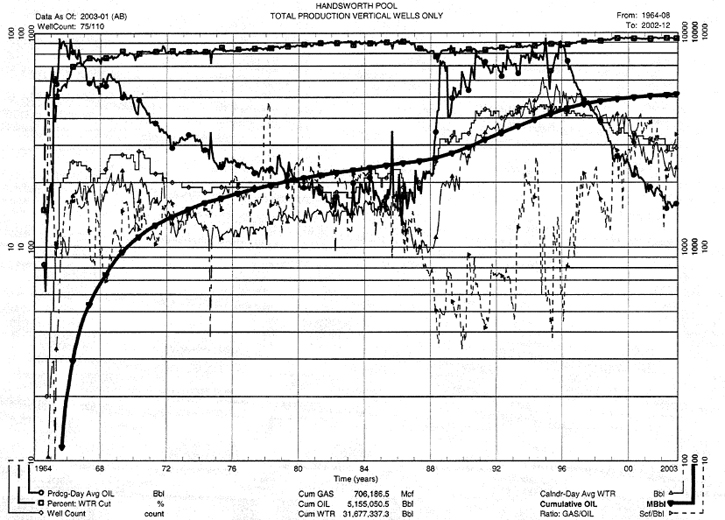 Plot of total production from vertical wells only, Handsworth Pool.
 Plot of total production from horizontal wells only, Handsworth Pool.
View the First Page
A text abstract of this article is not available. The first page of the PDF appears below.
You may download the first page as a PDF.

Pay-Per-View Purchase Options
The article is available through a document delivery service. Explain these Purchase Options.
| Watermarked PDF Document: $14 | |
| Open PDF Document: $24 |