The AAPG/Datapages Combined Publications Database
AAPG Bulletin
Figure
AAPG Bulletin; Year: 2014; Issue: October DOI: 10.1306/04301413177
Return to Full Text
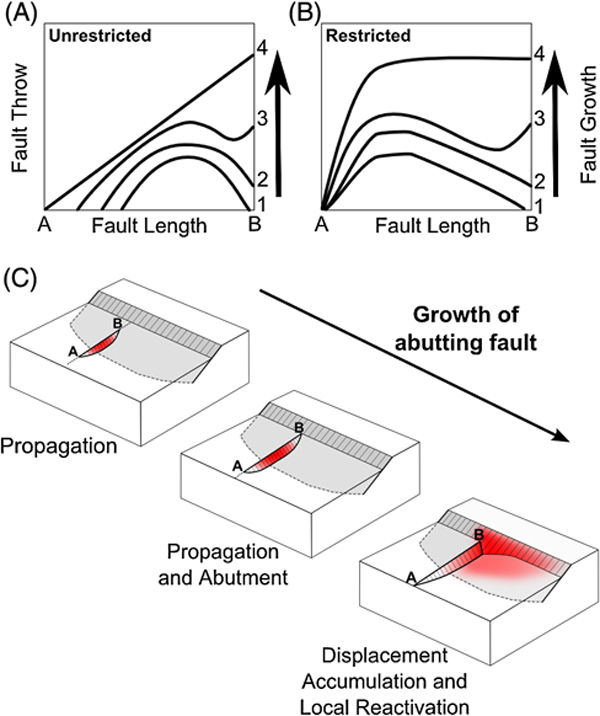
Figure 14. Schematic diagram of throw profiles for abutting faults at different stages of development. Stage 1 is an isolated fault profile. Stage 2 is an early-stage abutment with throw minima at the tips of the faults; Stage 3 is an intermediate stage with throw increasing at the abutting tip; and Stage 4 is a fully developed abutting fault with a maximum throw at the abutting tip. Panels (A) and (B) represent abutting faults with an unrestricted and restricted tip, respectively. (C) Three-dimensional cartoon illustrating a developing abutting fault shaded. The shading represents the displacement distribution of the abutting fault. See text for discussion.
Figure 14. Schematic diagram of throw profiles for abutting faults at different stages of development. Stage 1 is an isolated fault profile. Stage 2 is an early-stage abutment with throw minima at the tips of the faults; Stage 3 is an intermediate stage with throw increasing at the abutting tip; and Stage 4 is a fully developed abutting fault with a maximum throw at the abutting tip. Panels (A) and (B) represent abutting faults with an unrestricted and restricted tip, respectively. (C) Three-dimensional cartoon illustrating a developing abutting fault shaded. The shading represents the displacement distribution of the abutting fault. See text for discussion.