The AAPG/Datapages Combined Publications Database
AAPG Bulletin
Figure
AAPG Bulletin; Year: 2014; Issue: October DOI: 10.1306/04301413177
Return to Full Text
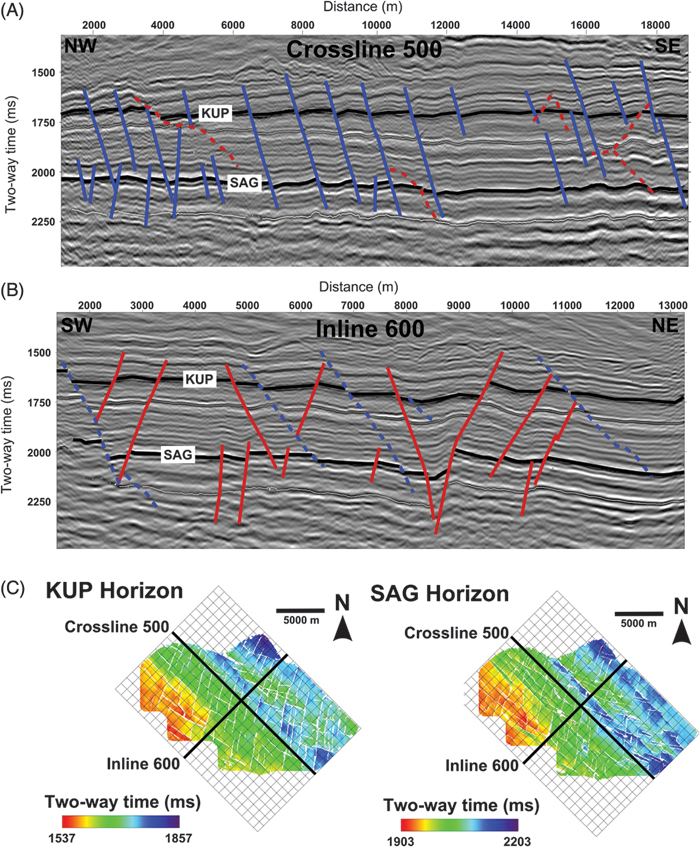
Figure 2. Seismic reflection images of (A) a northwest–southeast trending crossline and (B) a northeast–southwest trending in line. Red represents the west-northwest–trending fault set that was picked on the in lines and blue represents the north-northeast–trending fault set that was picked on the crosslines. Dashed lines are the faults that were not picked on the in line or crossline but have been projected onto the seismic section. (C) Location map showing the orientation of the in lines and crosslines.
Figure 2. Seismic reflection images of (A) a northwest–southeast trending crossline and (B) a northeast–southwest trending in line. Red represents the west-northwest–trending fault set that was picked on the in lines and blue represents the north-northeast–trending fault set that was picked on the crosslines. Dashed lines are the faults that were not picked on the in line or crossline but have been projected onto the seismic section. (C) Location map showing the orientation of the in lines and crosslines.