The AAPG/Datapages Combined Publications Database
AAPG Bulletin
Figure
AAPG Bulletin; Year: 2014; Issue: October DOI: 10.1306/04301413177
Return to Full Text
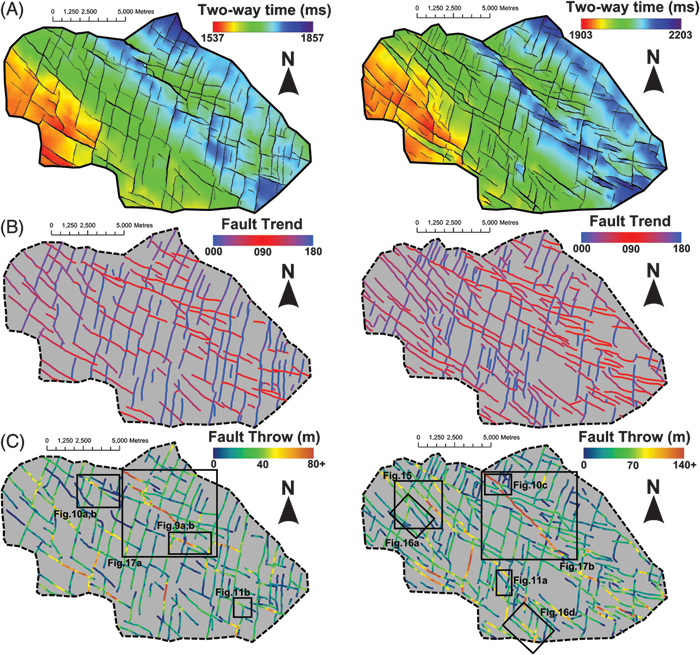
Figure 3. Fault maps of the KUP horizon on the left and the SAG horizon on the right: (A) Surface horizon maps showing the topography of the horizons; (B) fault map color-coded by azimuth with red generally representing west-northwest–faults and blue generally representing north-northeast-faults; (C) fault map color-coded by throw with blue and orange representing low- and high-throw values, respectively. The location of specific fault maps and 3-D diagrams used in later figures are also shown.
Figure 3. Fault maps of the KUP horizon on the left and the SAG horizon on the right: (A) Surface horizon maps showing the topography of the horizons; (B) fault map color-coded by azimuth with red generally representing west-northwest–faults and blue generally representing north-northeast-faults; (C) fault map color-coded by throw with blue and orange representing low- and high-throw values, respectively. The location of specific fault maps and 3-D diagrams used in later figures are also shown.