The AAPG/Datapages Combined Publications Database
AAPG Bulletin
Figure
AAPG Bulletin; Year: 2014; Issue: October DOI: 10.1306/04301413177
Return to Full Text
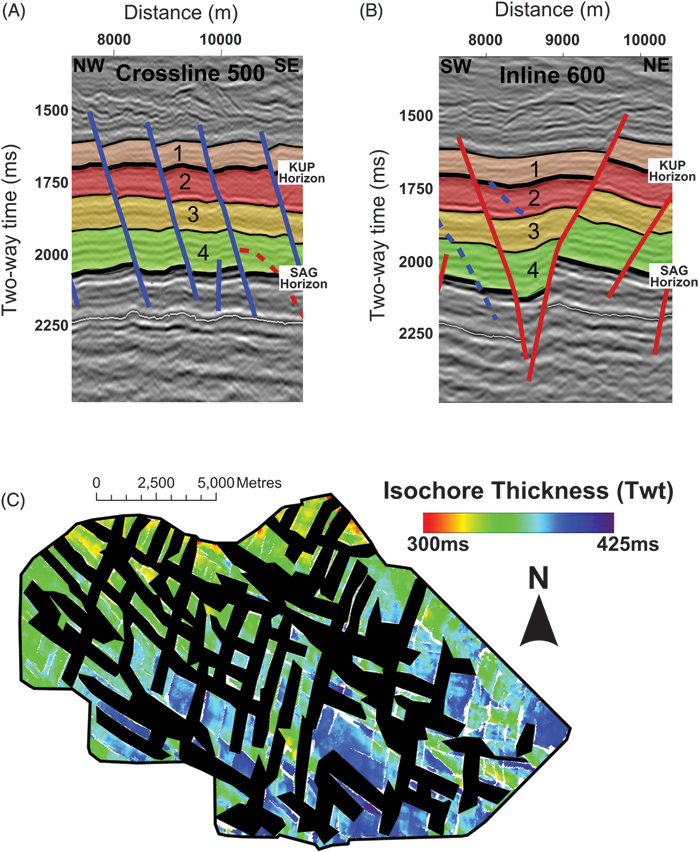
Figure 5. Interpreted seismic sections showing the stratigraphic thickness in relation to (A) the north-northeast–trending faults and (B) the west-northwest–trending faults. (C) An isochore map showing the variation in stratigraphic thickness (two-way time [TWT]) between the KUP and SAG horizons. The black patches cover the areas that have been tectonically thinned by throughgoing faults.
Figure 5. Interpreted seismic sections showing the stratigraphic thickness in relation to (A) the north-northeast–trending faults and (B) the west-northwest–trending faults. (C) An isochore map showing the variation in stratigraphic thickness (two-way time [TWT]) between the KUP and SAG horizons. The black patches cover the areas that have been tectonically thinned by throughgoing faults.