The AAPG/Datapages Combined Publications Database
AAPG Bulletin
Figure
AAPG Bulletin; Year: 2014; Issue: October DOI: 10.1306/04301413177
Return to Full Text
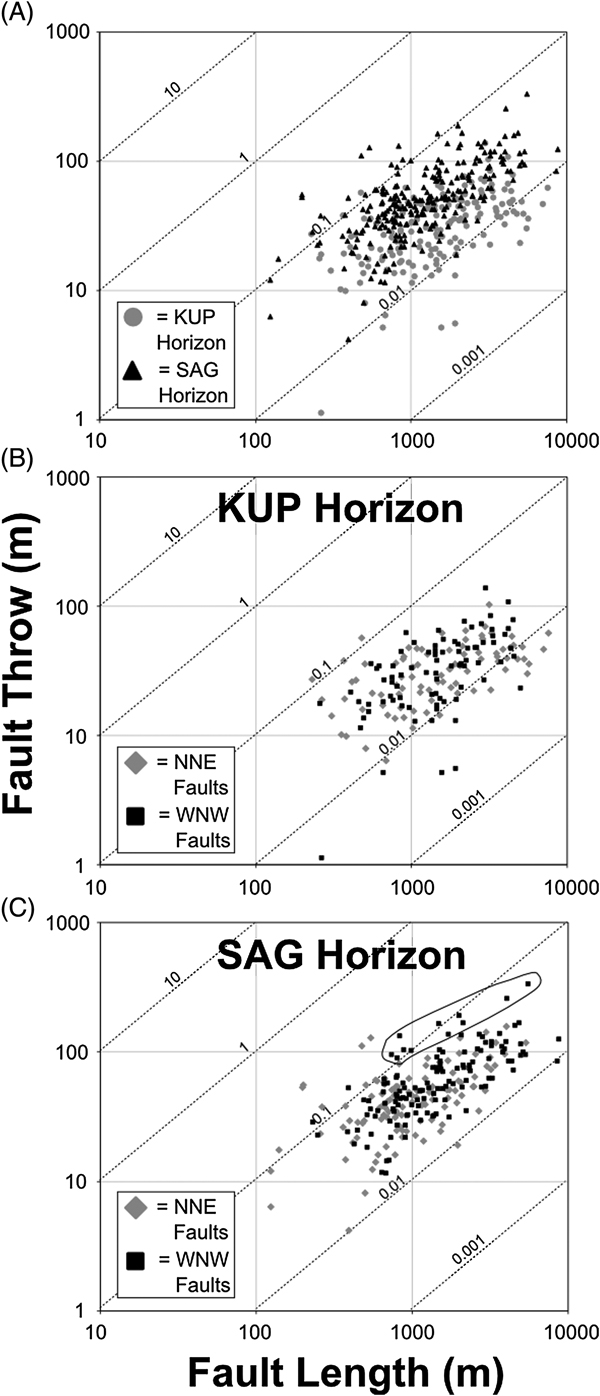
Figure 6. Logarithmic plots of fault length versus maximum throw for (A) all faults, (B) the KUP horizon, and (C) the SAG horizon. Note the significantly greater throws for some west-northwest–trending faults in the SAG horizon.
Figure 6. Logarithmic plots of fault length versus maximum throw for (A) all faults, (B) the KUP horizon, and (C) the SAG horizon. Note the significantly greater throws for some west-northwest–trending faults in the SAG horizon.