The AAPG/Datapages Combined Publications Database
AAPG Bulletin
Figure
AAPG Bulletin; Year: 2014; Issue: October DOI: 10.1306/04301413177
Return to Full Text
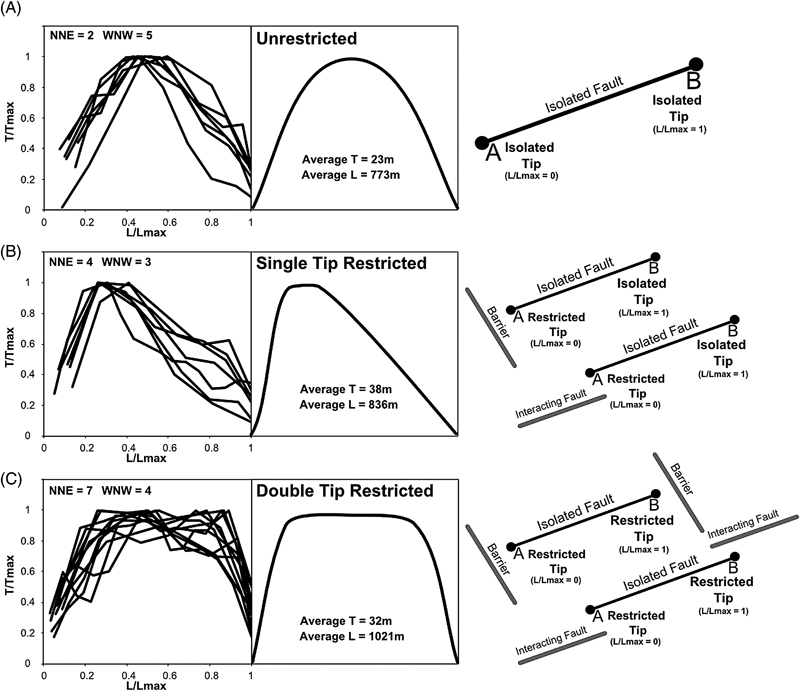
Figure 8. Normalized fault profiles for isolated faults from both the KUP and SAG horizons with length/maximum length ( ) along the x axis versus throw/maximum throw (
 ) on the y axis. (A) Isolated faults with unrestricted tips; (B) isolated faults with a single tip restricted; (C) isolated faults with both tips restricted. The graphs on the right side are cartoon representations of each profile.
Figure 8. Normalized fault profiles for isolated faults from both the KUP and SAG horizons with length/maximum length () along the x axis versus throw/maximum throw () on the y axis. (A) Isolated faults with unrestricted tips; (B) isolated faults with a single tip restricted; (C) isolated faults with both tips restricted. The graphs on the right side are cartoon representations of each profile.