The AAPG/Datapages Combined Publications Database
AAPG Bulletin
Figure
AAPG Bulletin; Year: 2015; Issue: June DOI: 10.1306/01191513190
Return to Full Text

Figure 15
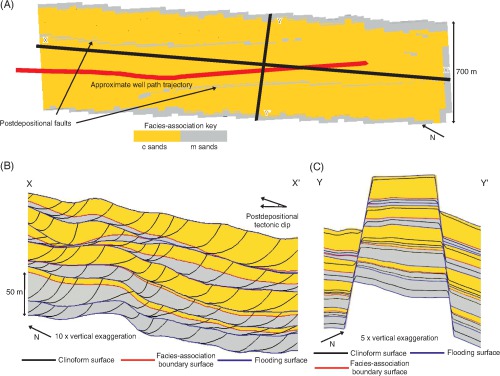
(A) Plan-view facies-association map through the uppermost parasequence of the Sognefjord Formation in our Troll West sector model, showing the location of compartmentalizing faults and a horizontal well. Cross sections along (B) depositional dip and (C) depositional strike, showing bounding flooding surfaces (blue), surfaces representing facies-association boundaries (red), and clinoforms generated by the modeling algorithm (black) for all parasequences in the model volume.

Figure 15 (A) Plan-view facies-association map through the uppermost parasequence of the Sognefjord Formation in our Troll West sector model, showing the location of compartmentalizing faults and a horizontal well. Cross sections along (B) depositional dip and (C) depositional strike, showing bounding flooding surfaces (blue), surfaces representing facies-association boundaries (red), and clinoforms generated by the modeling algorithm (black) for all parasequences in the model volume.