The AAPG/Datapages Combined Publications Database
AAPG Bulletin
Figure
AAPG Bulletin; Year: 2016; Issue: February DOI: 10.1306/08101515059
Return to Full Text
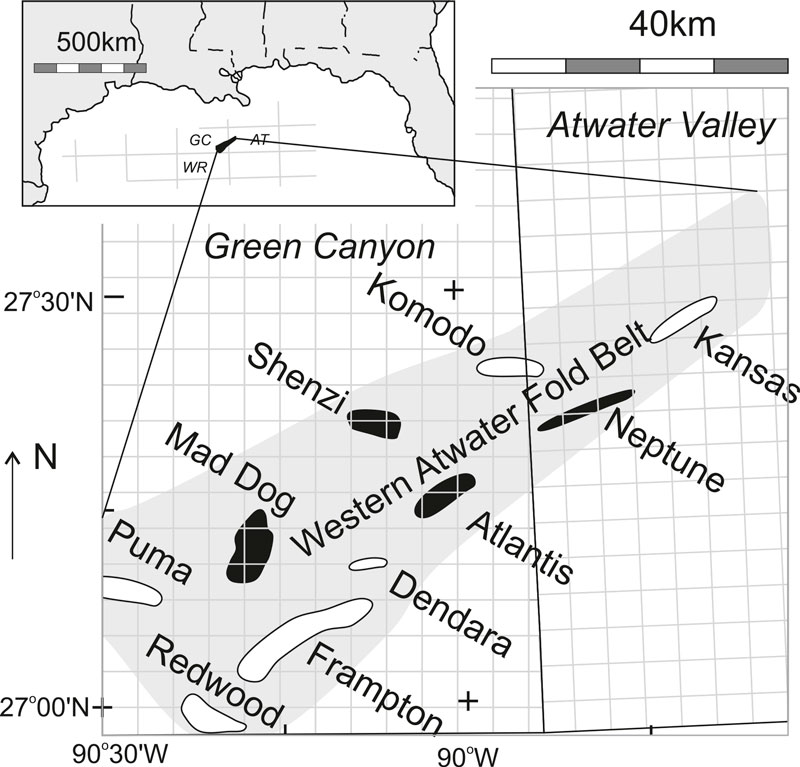
Figure 7. Outline map of the frontal fold trend of the Western Atwater fold belt, Gulf of Mexico (gray area on main map), showing the major structural traps with their original prospect names, with outlines from Moore et al. (2001) and Dias et al. (2010). Geological success cases at lower Miocene level are shown in solid black (Neptune, Atlantis, Mad Dog, and Shenzi oil fields); failure cases at lower Miocene level are shown in white. Note that some of these failure cases encountered oil at different stratigraphic levels or encountered dry gas in place of prognosed oil. Small squares are US Bureau of Ocean Energy Management Outer Continental Shelf lease blocks.
Figure 7. Outline map of the frontal fold trend of the Western Atwater fold belt, Gulf of Mexico (gray area on main map), showing the major structural traps with their original prospect names, with outlines from Moore et al. (2001) and Dias et al. (2010). Geological success cases at lower Miocene level are shown in solid black (Neptune, Atlantis, Mad Dog, and Shenzi oil fields); failure cases at lower Miocene level are shown in white. Note that some of these failure cases encountered oil at different stratigraphic levels or encountered dry gas in place of prognosed oil. Small squares are US Bureau of Ocean Energy Management Outer Continental Shelf lease blocks.