The AAPG/Datapages Combined Publications Database
AAPG Bulletin
Figure
AAPG Bulletin; Year: 2016; Issue: February DOI: 10.1306/08101515059
Return to Full Text
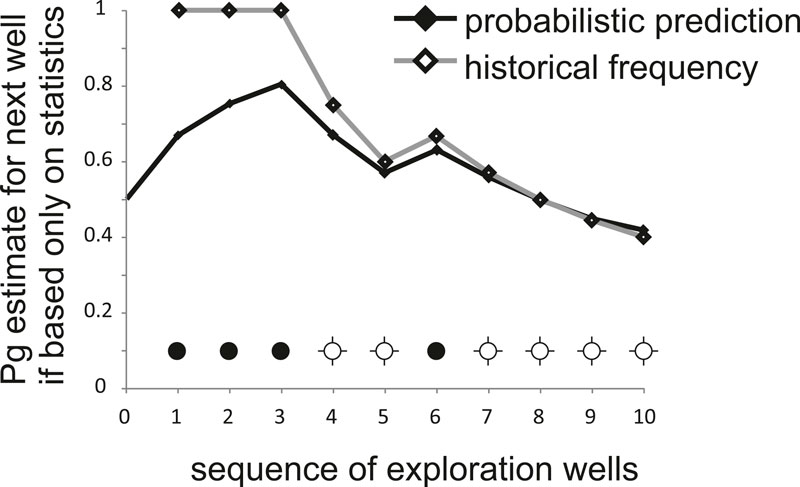
Figure 8. Sequence of drilling results for the first well testing a structure in lower Miocene play of the Western Atwater fold belt, showing a comparison of a prediction of the chance of success (Pg) of the next well, based on unmodified past frequency (open diamonds and gray line) compared with the probabilistic prediction using the rule of succession (black diamonds and black line). Black circles indicate geological success, and dry hole symbols (open circles with crosses) indicate that predrill geological model was not a success; note that some of these failure cases encountered hydrocarbons at other stratigraphic levels (e.g., Puma) or encountered dry gas in place of the prognosed oil (e.g., Frampton).
Figure 8. Sequence of drilling results for the first well testing a structure in lower Miocene play of the Western Atwater fold belt, showing a comparison of a prediction of the chance of success (Pg) of the next well, based on unmodified past frequency (open diamonds and gray line) compared with the probabilistic prediction using the rule of succession (black diamonds and black line). Black circles indicate geological success, and dry hole symbols (open circles with crosses) indicate that predrill geological model was not a success; note that some of these failure cases encountered hydrocarbons at other stratigraphic levels (e.g., Puma) or encountered dry gas in place of the prognosed oil (e.g., Frampton).