The AAPG/Datapages Combined Publications Database
AAPG Bulletin
Figure
AAPG Bulletin; Year: 2016; Issue: August DOI: 10.1306/02251615044
Return to Full Text
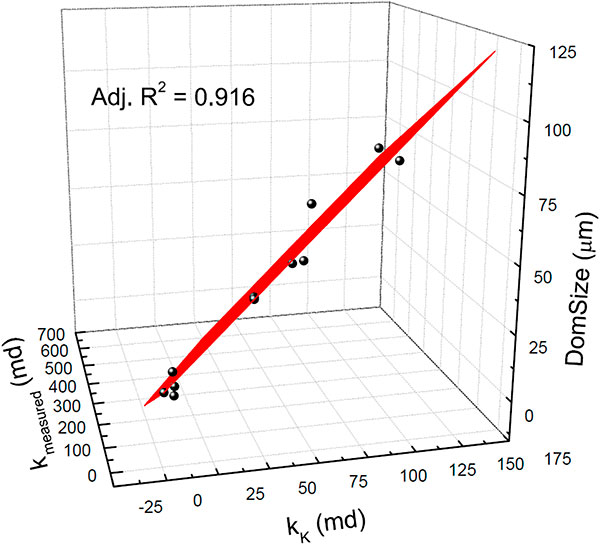
Figure 13. Three-dimensional crossplot of the relationship between dominant pore size (DomSize), estimated permeability (kk), and measured permeability (kmeasured). This figure shows the importance of the pore size as a factor controlling permeability. Adj. R2 = adjusted coefficient of determination.
Figure 13. Three-dimensional crossplot of the relationship between dominant pore size (DomSize), estimated permeability (kk), and measured permeability (kmeasured). This figure shows the importance of the pore size as a factor controlling permeability. Adj. R2 = adjusted coefficient of determination.