The AAPG/Datapages Combined Publications Database
AAPG Bulletin
Figure
AAPG Bulletin; Year: 2017; Issue: August DOI: 10.1306/10171616021
Return to Full Text
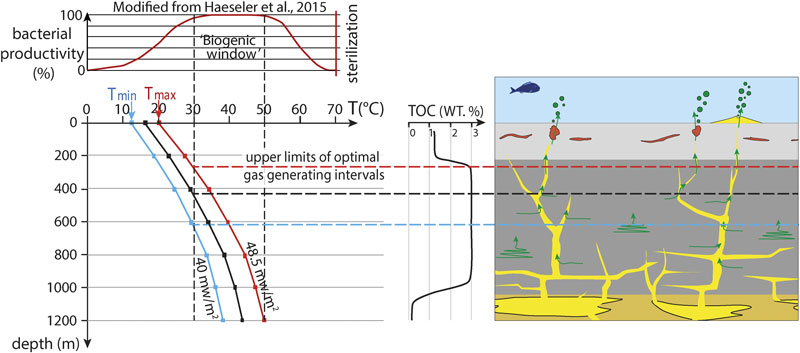
Figure 13. One-dimensional thermal model of the Moreno Formation at the time of seep carbonate precipitation. Three cases have been calculated using the minimum, average, and maximum values of sea-floor temperature (Tmin–Tmax) and heat flow taken from literature (see references in text). The curve of bacterial activity as a function of temperature is from Haeseler et al. (2015). The three upper limits of the optimal biogenic gas window were calculated at 200, 400, and 600 m below sea floor. T = temperature; TOC = total organic carbon.
Figure 13. One-dimensional thermal model of the Moreno Formation at the time of seep carbonate precipitation. Three cases have been calculated using the minimum, average, and maximum values of sea-floor temperature (Tmin–Tmax) and heat flow taken from literature (see references in text). The curve of bacterial activity as a function of temperature is from Haeseler et al. (2015). The three upper limits of the optimal biogenic gas window were calculated at 200, 400, and 600 m below sea floor. T = temperature; TOC = total organic carbon.