The AAPG/Datapages Combined Publications Database
AAPG Bulletin
Figure
AAPG Bulletin; Year: 2019; Issue: October DOI: 10.1306/0130191516517255
Return to Full Text
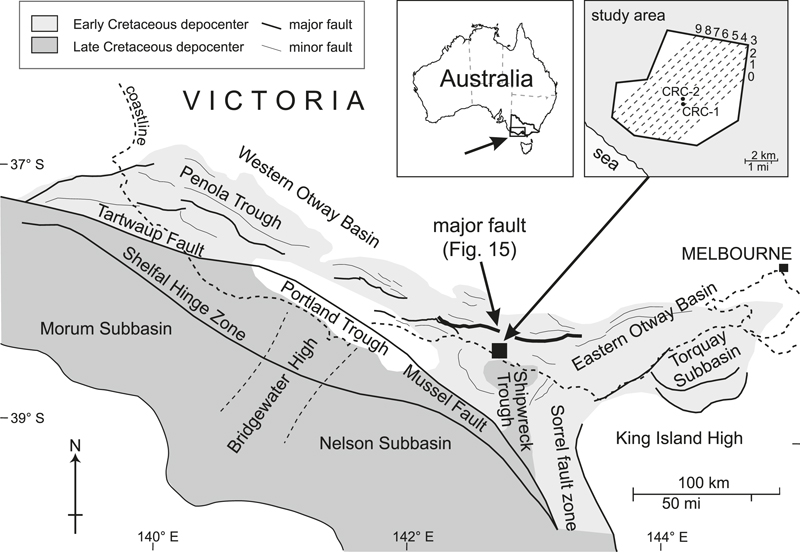
Figure 1. Overview map of the regional tectonics, showing major normal faults in the Otway Basin (compiled from Douglas and Ferguson, 1988; Alley and Lindsay, 1995; Perincek and Cockshell, 1995; Moore et al., 2000). Cretaceous sedimentary rocks marked in gray. Close-up of the study area, showing borehole locations (Cooperative Research Centre [CRC]-1, -2) and the traces of the profiles (0–9) used for the extension versus age diagram (Figure 11). Major fault is marked.
Figure 1. Overview map of the regional tectonics, showing major normal faults in the Otway Basin (compiled from Douglas and Ferguson, 1988; Alley and Lindsay, 1995; Perincek and Cockshell, 1995; Moore et al., 2000). Cretaceous sedimentary rocks marked in gray. Close-up of the study area, showing borehole locations (Cooperative Research Centre [CRC]-1, -2) and the traces of the profiles (0–9) used for the extension versus age diagram (Figure 11). Major fault is marked.