The AAPG/Datapages Combined Publications Database
AAPG Bulletin
Figure
AAPG Bulletin; Year: 2019; Issue: October DOI: 10.1306/0130191516517255
Return to Full Text
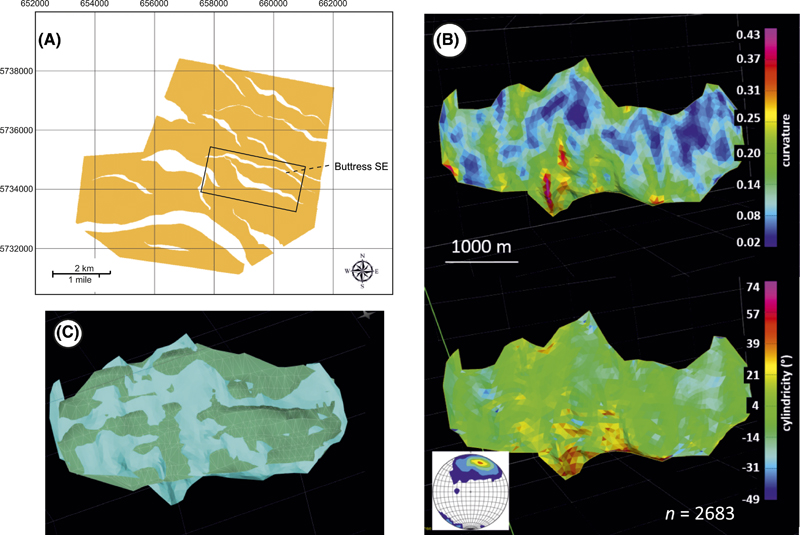
Figure 17. (A) Map showing the location of fault Buttress Southeast (SE). Black box shows the area modeled in Figure 18. (B) Surface of fault Buttress SE; color-coded by curvature (above) and cylindricity (below); insert shows stereographic projection of poles to the surface triangles. (C) Two triangulated fault surfaces of Buttress SE. The lighter blue surface represents the 75-m (246-ft) gridded surface used in this work. The darker green surface represents the 150-m (492-ft) gridded surface. Grid coordinate system: Map Grid of Australia, zone 54, Transverse Mercator projection.
Figure 17. (A) Map showing the location of fault Buttress Southeast (SE). Black box shows the area modeled in Figure 18. (B) Surface of fault Buttress SE; color-coded by curvature (above) and cylindricity (below); insert shows stereographic projection of poles to the surface triangles. (C) Two triangulated fault surfaces of Buttress SE. The lighter blue surface represents the 75-m (246-ft) gridded surface used in this work. The darker green surface represents the 150-m (492-ft) gridded surface. Grid coordinate system: Map Grid of Australia, zone 54, Transverse Mercator projection.