The AAPG/Datapages Combined Publications Database
AAPG Bulletin
Figure
AAPG Bulletin; Year: 2019; Issue: October DOI: 10.1306/0130191516517255
Return to Full Text
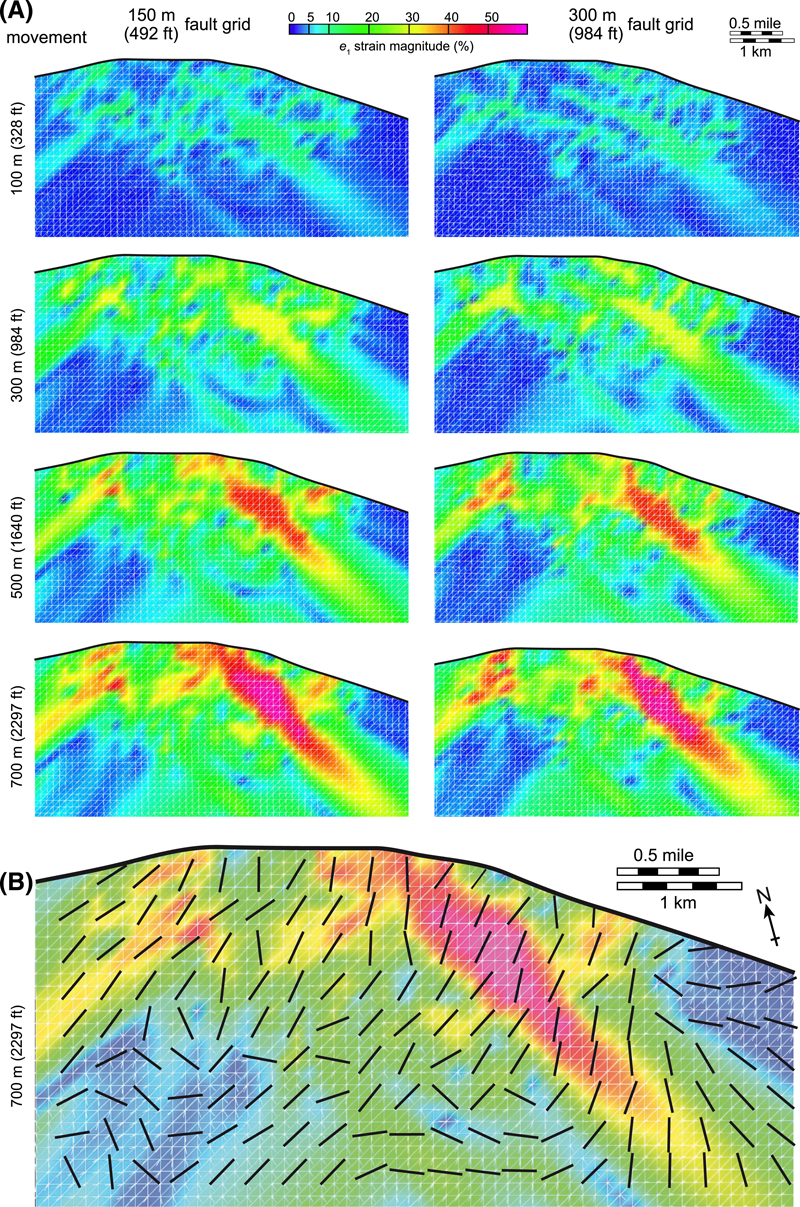
Figure 18. (A) Forward modeling of a planar volume (75 m [246 ft] mesh) along the fault Buttress Southeast at different amounts of movement (100 m [328 ft], 300 m [984 ft], 500 m [1640 ft], and 700 m [2297 ft]). The  strain magnitude, where e is the strain value and
  is the principal major strain axis, is color-coded and represents the cumulative strain. The left column represents the 150-m (492-ft) fault grid and the right column represents the 300-m (984-ft) fault grid. (B) Example for the strain map and the resultant strike direction (black lines) of subseismic scale fractures.
Figure 18. (A) Forward modeling of a planar volume (75 m [246 ft] mesh) along the fault Buttress Southeast at different amounts of movement (100 m [328 ft], 300 m [984 ft], 500 m [1640 ft], and 700 m [2297 ft]). The strain magnitude, where e is the strain value and is the principal major strain axis, is color-coded and represents the cumulative strain. The left column represents the 150-m (492-ft) fault grid and the right column represents the 300-m (984-ft) fault grid. (B) Example for the strain map and the resultant strike direction (black lines) of subseismic scale fractures.