The AAPG/Datapages Combined Publications Database
AAPG Bulletin
Figure
AAPG Bulletin; Year: 2020; Issue: May DOI: 10.1306/11111917396
Return to Full Text
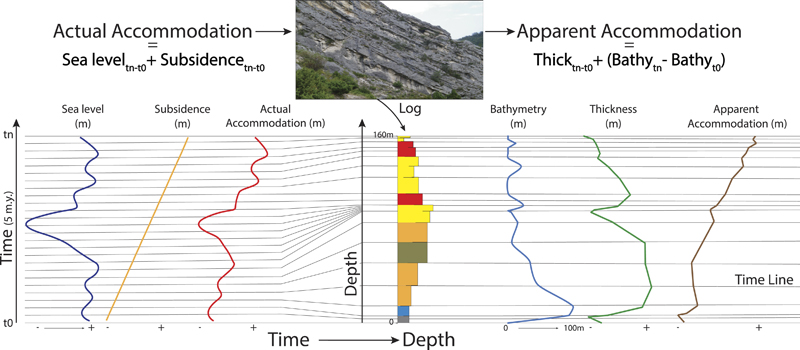
Figure 3. Space–time relationships between actual and apparent accommodation analyzed from a typical carbonate platform outcrop. Subsidence and sea-level curves that define the actual accommodation are expressed as a function of time, whereas the apparent accommodation, calculated from bed thickness and paleobathymetry, is expressed as a function of depth. Without strong assumptions on the time–depth function, it is difficult to extract the actual accommodation time curve directly from such sedimentary records. Facies legend in Figure 2. Bathy = Bathymetry; t0 = 0 m.y.; tn = 5 m.y.
Figure 3. Space–time relationships between actual and apparent accommodation analyzed from a typical carbonate platform outcrop. Subsidence and sea-level curves that define the actual accommodation are expressed as a function of time, whereas the apparent accommodation, calculated from bed thickness and paleobathymetry, is expressed as a function of depth. Without strong assumptions on the time–depth function, it is difficult to extract the actual accommodation time curve directly from such sedimentary records. Facies legend in Figure 2. Bathy = Bathymetry; t0 = 0 m.y.; tn = 5 m.y.