The AAPG/Datapages Combined Publications Database
AAPG Bulletin
Figure
AAPG Bulletin; Year: 2020; Issue: May DOI: 10.1306/11111917396
Return to Full Text
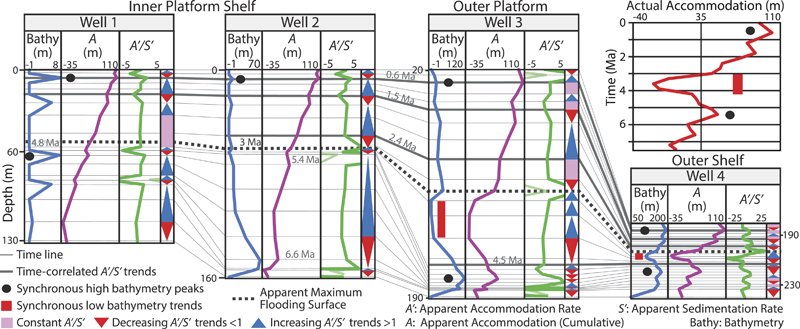
Figure 6. Proximal-to-distal correlation panel of pseudowells, with curves of water depth and apparent sequence stratigraphic parameters calculated from the modeled stratigraphic grids (Figures 4, 5). Time lines correspond to the simulated layers in the stratigraphic grid. Triangles represent apparent accommodation rate and the sedimentation rate (A′/S′) trends, decreasing or increasing. All the curves can be compared to the real accommodation curve in the upper right caption. This panel intends to mimic stratigraphic well correlation in space domain and illustrate the erratic time correlation of apparent parameters (bathymetry, A, and A′/S′) and system tracts (triangles). The actual accommodation signal in time is well preserved (as expected) in the distal and deeper domain, with no hiatus and stable sedimentation rates. See detailed explanations in the text.
Figure 6. Proximal-to-distal correlation panel of pseudowells, with curves of water depth and apparent sequence stratigraphic parameters calculated from the modeled stratigraphic grids (Figures 4, 5). Time lines correspond to the simulated layers in the stratigraphic grid. Triangles represent apparent accommodation rate and the sedimentation rate (A′/S′) trends, decreasing or increasing. All the curves can be compared to the real accommodation curve in the upper right caption. This panel intends to mimic stratigraphic well correlation in space domain and illustrate the erratic time correlation of apparent parameters (bathymetry, A, and A′/S′) and system tracts (triangles). The actual accommodation signal in time is well preserved (as expected) in the distal and deeper domain, with no hiatus and stable sedimentation rates. See detailed explanations in the text.