The AAPG/Datapages Combined Publications Database
AAPG Bulletin
Figure
AAPG Bulletin; Year: 2020; Issue: May DOI: 10.1306/11111917396
Return to Full Text
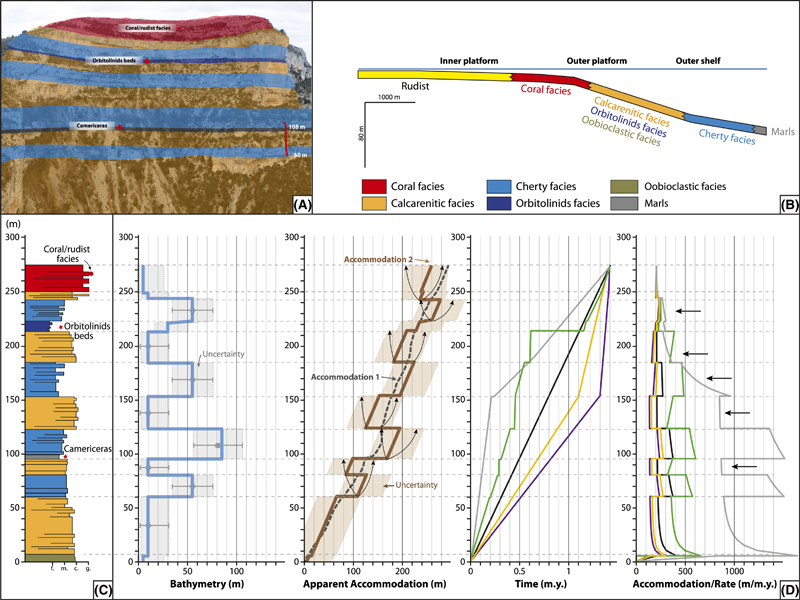
Figure 9. Estimation of apparent accommodation and accommodation rates from a real carbonate stratigraphic succession (modified from Léonide et al., 2012): Early Cretaceous carbonate platform in Provence (southeastern France), Le Rocher du Cire outcrop (A) (cf. location in Figure 2). Facies (B) and sedimentary sequences (C) correspond to outer-platform and outer-shelf environments and are dominated by bioclastic grainstones and wackestones with abundant cherts. Inner-platform facies and exposure surfaces are absent from this succession. Carbonate grain size: fine sand (f.), medium sand (m.), coarse sand (c.), gravel (g.). (D) Calculated sequence stratigraphic parameters (blue and brown shadings represent uncertainty ranges). The mean bathymetry curve is displayed with an uncertainty range, but sediment compaction is not considered. Cumulative apparent accommodation is calculated by considering the bathymetry uncertainties and the bed thickness. The mean curve (accommodation 1) corresponds to the mean bathymetry and displays an overall increasing trend and several cycles of accommodation decrease and increase. The dashed curve (accommodation 2) is a possible scenario of smoothed increasing accommodation, without cyclic variations, that falls within the uncertainty range. Smaller arrows indicate opposite vertical trends of accommodation in several intervals that fall within the uncertainty range. This simple calculation demonstrates that in thick, relatively deep carbonate successions, if the bathymetry uncertainty equals the bed thickness, it is not straightforward to interpret the real accommodation. Estimation of accommodation rates (and sedimentation rates), which are fundamental sequence stratigraphic parameters for interpreting system tracts, relies on a hypothetical and uncertain time–thickness function. Opposite vertical trends of the accommodation rate can be calculated in several intervals (horizontal arrows) depending on the time–thickness function. The colors of the accommodation rate curves correspond to the different the time–depth functions (graph on the left).
Figure 9. Estimation of apparent accommodation and accommodation rates from a real carbonate stratigraphic succession (modified from Léonide et al., 2012): Early Cretaceous carbonate platform in Provence (southeastern France), Le Rocher du Cire outcrop (A) (cf. location in Figure 2). Facies (B) and sedimentary sequences (C) correspond to outer-platform and outer-shelf environments and are dominated by bioclastic grainstones and wackestones with abundant cherts. Inner-platform facies and exposure surfaces are absent from this succession. Carbonate grain size: fine sand (f.), medium sand (m.), coarse sand (c.), gravel (g.). (D) Calculated sequence stratigraphic parameters (blue and brown shadings represent uncertainty ranges). The mean bathymetry curve is displayed with an uncertainty range, but sediment compaction is not considered. Cumulative apparent accommodation is calculated by considering the bathymetry uncertainties and the bed thickness. The mean curve (accommodation 1) corresponds to the mean bathymetry and displays an overall increasing trend and several cycles of accommodation decrease and increase. The dashed curve (accommodation 2) is a possible scenario of smoothed increasing accommodation, without cyclic variations, that falls within the uncertainty range. Smaller arrows indicate opposite vertical trends of accommodation in several intervals that fall within the uncertainty range. This simple calculation demonstrates that in thick, relatively deep carbonate successions, if the bathymetry uncertainty equals the bed thickness, it is not straightforward to interpret the real accommodation. Estimation of accommodation rates (and sedimentation rates), which are fundamental sequence stratigraphic parameters for interpreting system tracts, relies on a hypothetical and uncertain time–thickness function. Opposite vertical trends of the accommodation rate can be calculated in several intervals (horizontal arrows) depending on the time–thickness function. The colors of the accommodation rate curves correspond to the different the time–depth functions (graph on the left).