The AAPG/Datapages Combined Publications Database
AAPG Bulletin
Figure
AAPG Bulletin; Year: 2020; Issue: May DOI: 10.1306/10031919011
Return to Full Text
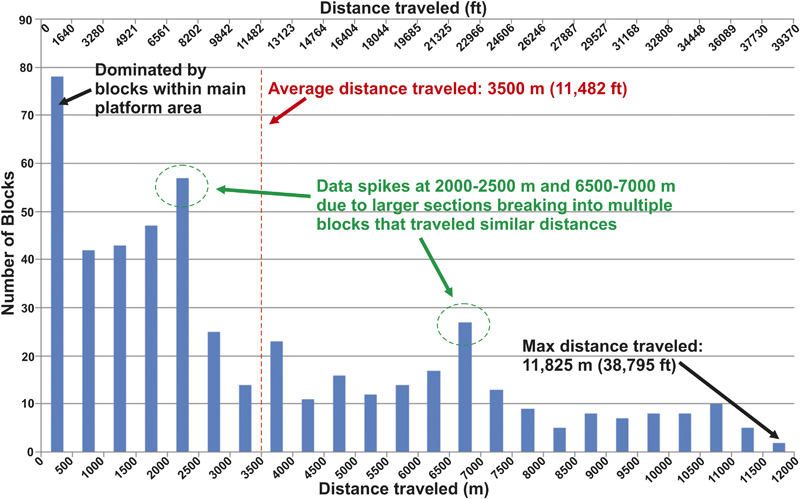
Figure 11. A histogram showing the distribution of block sliding distances calculated during the landslide reconstruction process. Max = maximum.
Figure 11. A histogram showing the distribution of block sliding distances calculated during the landslide reconstruction process. Max = maximum.