The AAPG/Datapages Combined Publications Database
AAPG Bulletin
Figure
AAPG Bulletin; Year: 2020; Issue: May DOI: 10.1306/10031919011
Return to Full Text
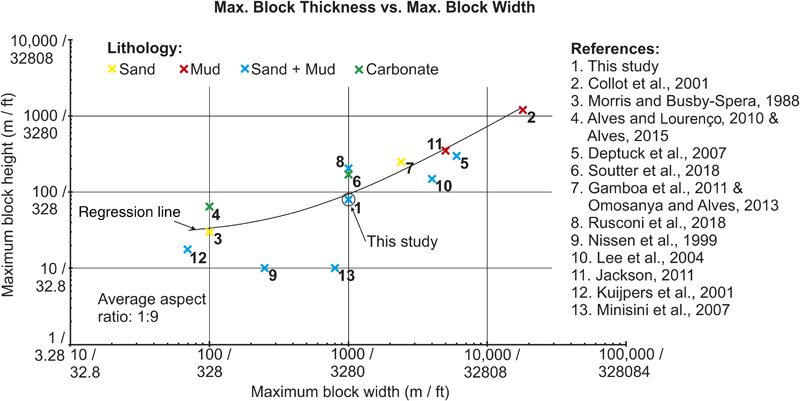
Figure 17. A graph showing the relationship between the maximum (Max.) block height and the Max. block width for this study and mass transport deposit (MTD) blocks observed within analog MTDs. These data are shown in Table 1, and references are shown in the figure.
Figure 17. A graph showing the relationship between the maximum (Max.) block height and the Max. block width for this study and mass transport deposit (MTD) blocks observed within analog MTDs. These data are shown in Table 1, and references are shown in the figure.