The AAPG/Datapages Combined Publications Database
AAPG Bulletin
Figure
AAPG Bulletin; Year: 2020; Issue: May DOI: 10.1306/10031919011
Return to Full Text
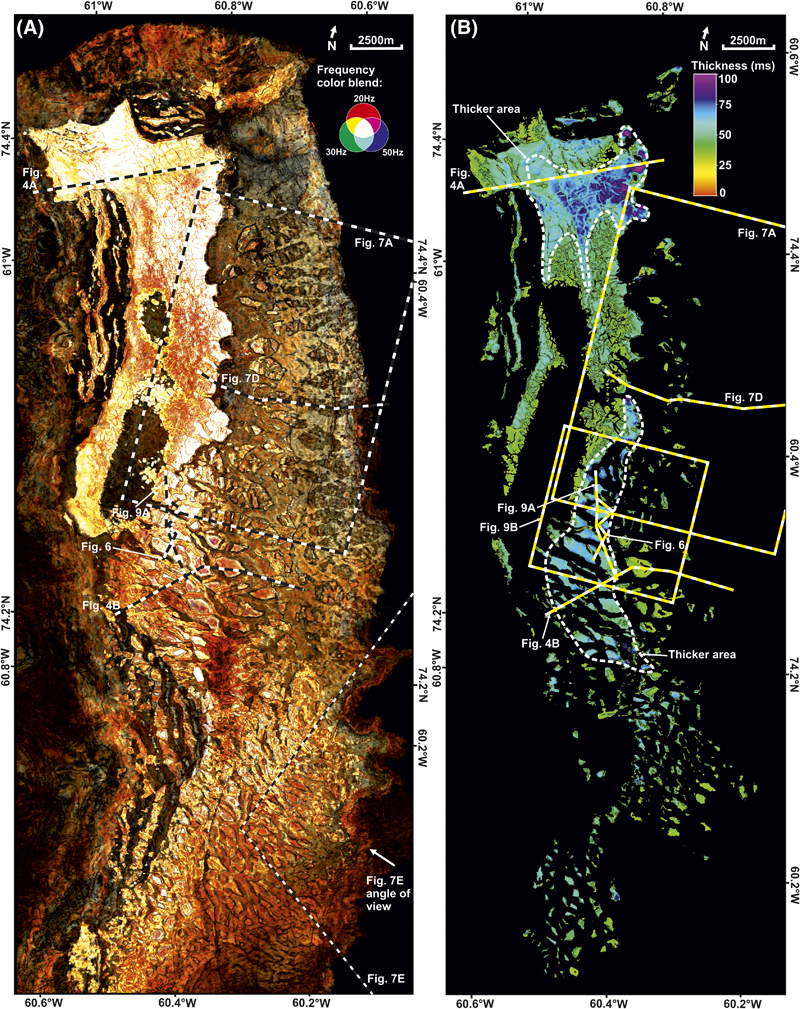
Figure 5. Reservoir distribution and character. (A) Spectral decomposition red, green, and blue (RGB) extraction on the top reservoir surface across the Pitu high-resolution seismic survey. The RGB blend is composed of 20-Hz (red), 30-Hz (green), and 50-Hz (blue) frequency band volumes, created and visualized within Geoteric. (B) A thickness map between the top reservoir and decollement surfaces (filtered to only show thicknesses >30 ms). Two areas of thicker reservoir are highlighted. The locations of Figures 4A, B; 6; 7A, D, E; and 9A, B are shown.
Figure 5. Reservoir distribution and character. (A) Spectral decomposition red, green, and blue (RGB) extraction on the top reservoir surface across the Pitu high-resolution seismic survey. The RGB blend is composed of 20-Hz (red), 30-Hz (green), and 50-Hz (blue) frequency band volumes, created and visualized within Geoteric. (B) A thickness map between the top reservoir and decollement surfaces (filtered to only show thicknesses >30 ms). Two areas of thicker reservoir are highlighted. The locations of Figures 4A, B; 6; 7A, D, E; and 9A, B are shown.