The AAPG/Datapages Combined Publications Database
AAPG Bulletin
Figure
AAPG Bulletin; Year: 2021; Issue: March DOI: 10.1306/08192019076
Return to Full Text
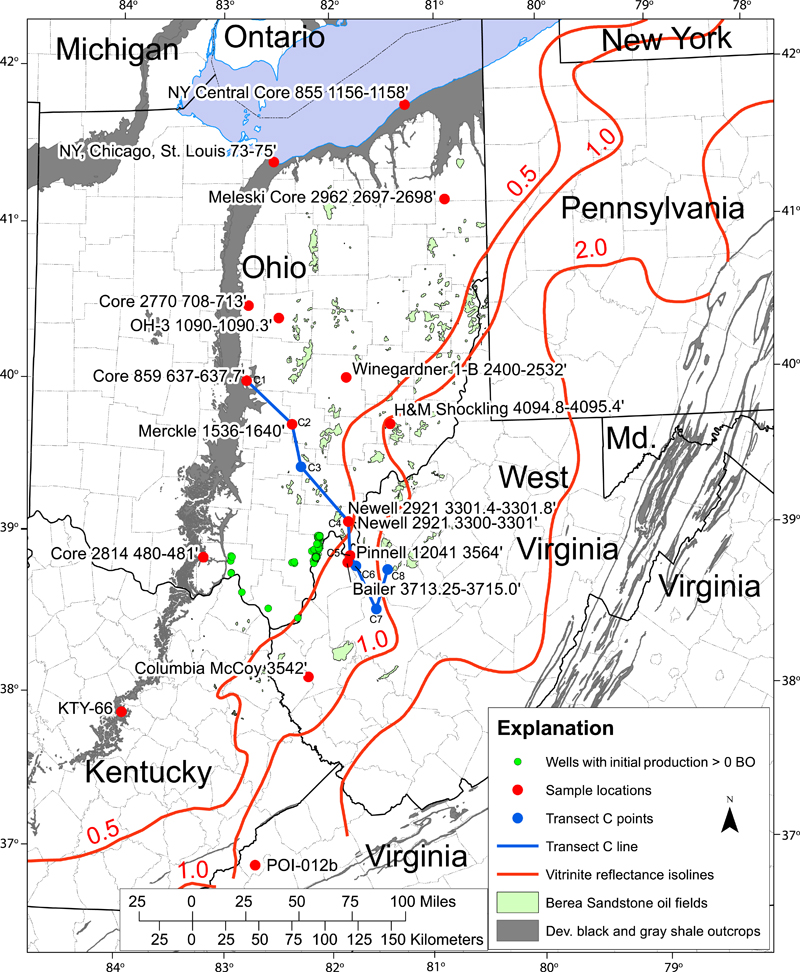
Figure 1. Map of study area showing sample locations, Devonian (Dev.) shale outcrop (Ryder et al., 2013), Dev. shale reflectance isolines from East et al. (2012), and oil fields in the Dev. Berea Sandstone. Oil wells with initial production > 0 bbl of oil in southern Ohio and Berea Sandstone oil field outlines are from publicly available online data from the Ohio, Kentucky, and West Virginia state geological surveys. Samples (red circles) are identified by name and depth in feet (‘). BO = barrels of oil; Md. = Maryland; NY = New York.
Figure 1. Map of study area showing sample locations, Devonian (Dev.) shale outcrop (Ryder et al., 2013), Dev. shale reflectance isolines from East et al. (2012), and oil fields in the Dev. Berea Sandstone. Oil wells with initial production > 0 bbl of oil in southern Ohio and Berea Sandstone oil field outlines are from publicly available online data from the Ohio, Kentucky, and West Virginia state geological surveys. Samples (red circles) are identified by name and depth in feet (‘). BO = barrels of oil; Md. = Maryland; NY = New York.