The AAPG/Datapages Combined Publications Database
AAPG Bulletin
Figure
AAPG Bulletin; Year: 2021; Issue: March DOI: 10.1306/08192019076
Return to Full Text

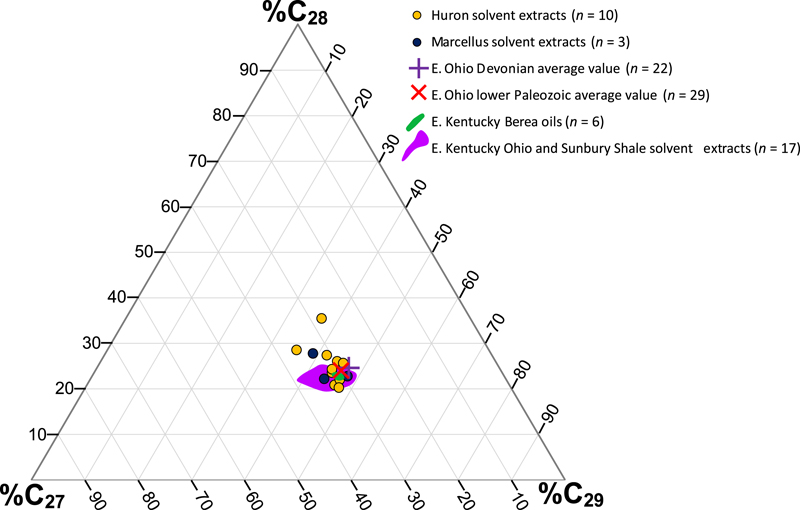
Figure 10. Ternary plot of normal sterane (5α, 14β, 17β [20S], m/z 218) distributions. Average Berea and Ohio Shale-reservoired (n = 22) and lower Paleozoic-reservoired (n = 29) oil from eastern (E.) Ohio shown for comparison. Data from GeoMark (2015). Data fields for E. Kentucky Ohio Shale and Sunbury Shale solvent extracts and Berea oils from Hackley et al. (2021, this issue). Huron and Marcellus data (dots) from this study.

Figure 10. Ternary plot of normal sterane (5α, 14β, 17β [20S], m/z 218) distributions. Average Berea and Ohio Shale-reservoired (n = 22) and lower Paleozoic-reservoired (n = 29) oil from eastern (E.) Ohio shown for comparison. Data from GeoMark (2015). Data fields for E. Kentucky Ohio Shale and Sunbury Shale solvent extracts and Berea oils from Hackley et al. (2021, this issue). Huron and Marcellus data (dots) from this study.