The AAPG/Datapages Combined Publications Database
AAPG Bulletin
Figure
AAPG Bulletin; Year: 2021; Issue: March DOI: 10.1306/08192019076
Return to Full Text
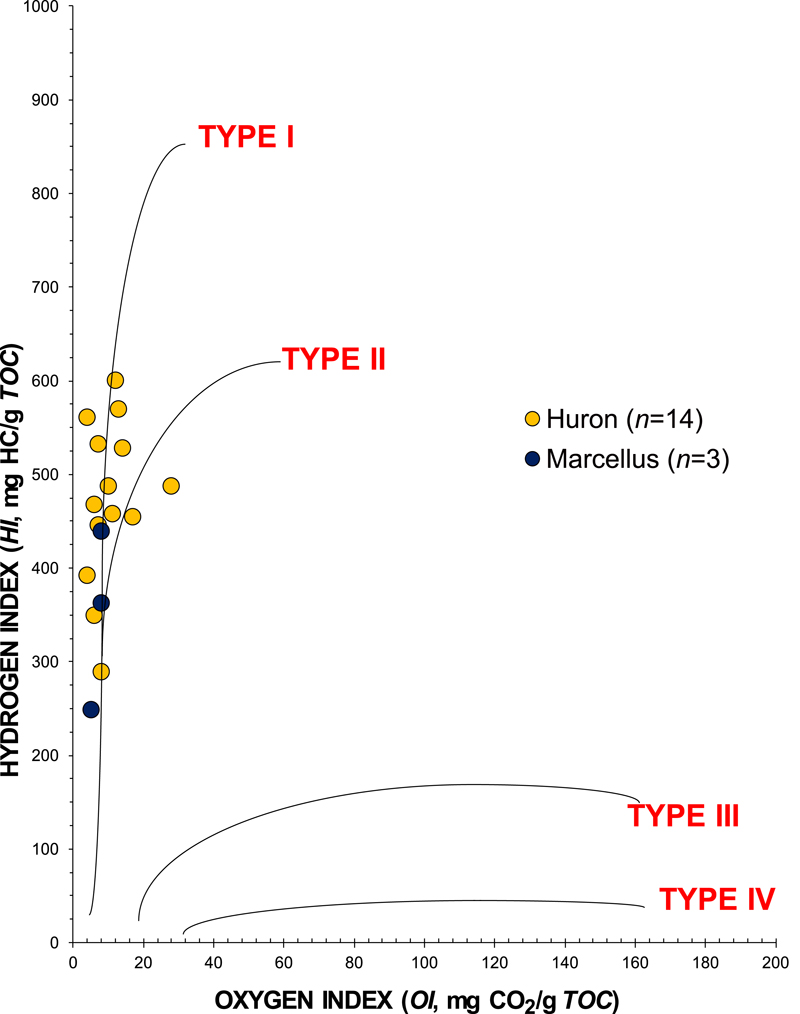
Figure 4. The hydrogen index (HI, S2×100/total organic carbon [TOC] in milligrams of hydrocarbons per gram of TOC) versus oxygen index (OI, S3×100/TOC in milligrams of CO2 per gram of TOC) modified Van Krevelen chart. The kerogen type evolution lines are based on multiple sources (Espitalié et al., 1985; Peters, 1986; Hart and Steen, 2015).
Figure 4. The hydrogen index (HI, S2×100/total organic carbon [TOC] in milligrams of hydrocarbons per gram of TOC) versus oxygen index (OI, S3×100/TOC in milligrams of CO2 per gram of TOC) modified Van Krevelen chart. The kerogen type evolution lines are based on multiple sources (Espitalié et al., 1985; Peters, 1986; Hart and Steen, 2015).