The AAPG/Datapages Combined Publications Database
AAPG Bulletin
Figure
AAPG Bulletin; Year: 2021; Issue: March DOI: 10.1306/08192019076
Return to Full Text

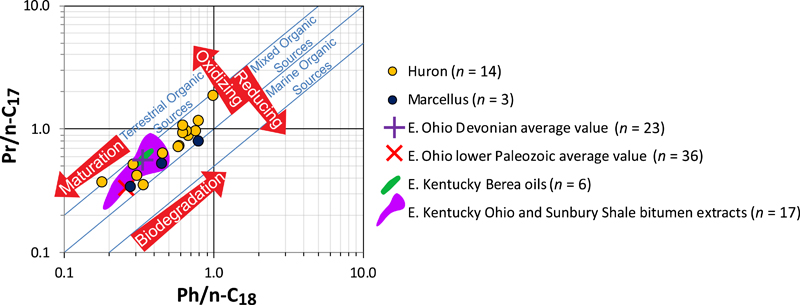
Figure 8. Pristane (Pr)/n-C17 and phytane (Ph)/n-C18 discriminant plot. Data fields for eastern (E.) Kentucky Ohio Shale and Sunbury Shale solvent extracts and Berea oils from Hackley et al. (2021, this issue). Average Berea- and Ohio Shale–reservoired (n = 23) and lower Paleozoic-reservoired (n = 36) oil from E. Ohio according to data from GeoMark (2015) shown for comparison. Organic source fields and process directions after Shanmugam (1985). Huron and Marcellus data (dots) from this study.

Figure 8. Pristane (Pr)/n-C17 and phytane (Ph)/n-C18 discriminant plot. Data fields for eastern (E.) Kentucky Ohio Shale and Sunbury Shale solvent extracts and Berea oils from Hackley et al. (2021, this issue). Average Berea- and Ohio Shale–reservoired (n = 23) and lower Paleozoic-reservoired (n = 36) oil from E. Ohio according to data from GeoMark (2015) shown for comparison. Organic source fields and process directions after Shanmugam (1985). Huron and Marcellus data (dots) from this study.