The AAPG/Datapages Combined Publications Database
AAPG Bulletin
Figure
AAPG Bulletin; Year: 2021; Issue: March DOI: 10.1306/08192019077
Return to Full Text

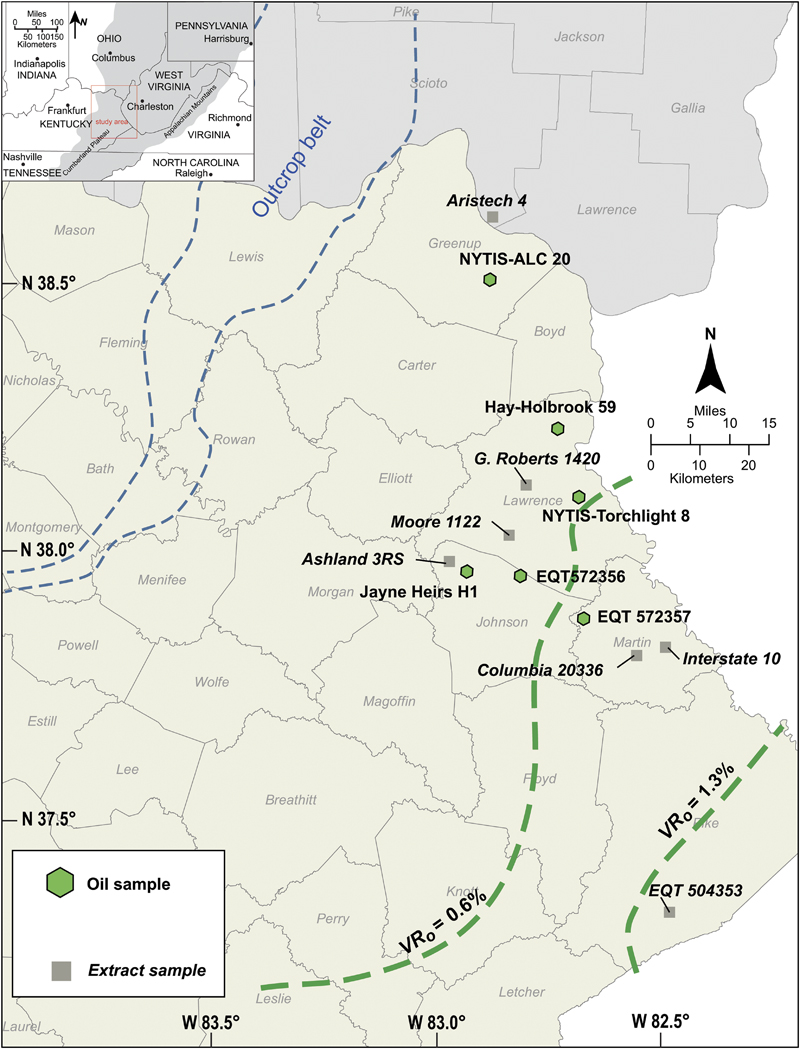
Figure 2. Location of solvent extract and oil samples. The 0.6% and 1.3% vitrinite reflectance (VRo) isolines are from East et al. (2012). Kentucky and Ohio counties in tan and gray, respectively. Gray in the index map shows the extent of the Appalachian Basin. Modified from Parris et al. (2019) with permission of Kentucky Geological Survey.

Figure 2. Location of solvent extract and oil samples. The 0.6% and 1.3% vitrinite reflectance (VRo) isolines are from East et al. (2012). Kentucky and Ohio counties in tan and gray, respectively. Gray in the index map shows the extent of the Appalachian Basin. Modified from Parris et al. (2019) with permission of Kentucky Geological Survey.