The AAPG/Datapages Combined Publications Database
AAPG Bulletin
Figure
AAPG Bulletin; Year: 2021; Issue: October DOI: 10.1306/04232120046
Return to Full Text
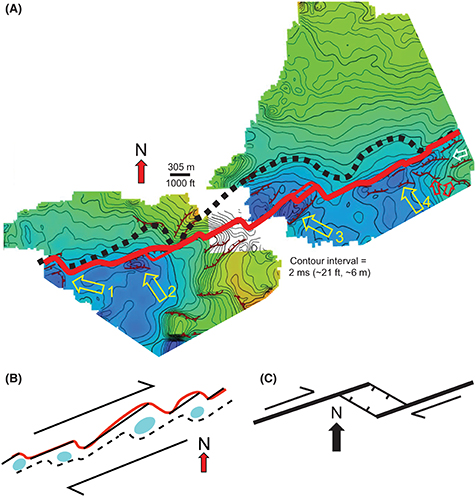
Figure 12.
(A) Time-structure map on the top of Proterozoic basement in eastern New York State based on three-dimensional seismic surveys. Approximate location is within the eastern white-dashed box in Figure 1. Color ramp for depth is green and orange = high, blue = low. Red line indicates the generalized trace of the main series of linked northeast-striking faults. Dashed black line indicates approximate northwestern extent of significant downwarping related to the grabens. Both the black dashed line and the red line display right steps in the fault system. Brown hachured lines indicate fault traces picked on each inline and crossline (dip-slip component of fault motion is down on the hachured side). Easterly striking fault traces are indicated by red and white arrows (see text for discussion of red and white arrows). Yellow arrows indicate deepest parts of the grabens, which are located near right steps of the fault system. This geometrical relationship is especially evident in the southwestern two grabens (no. 1 and no. 2). (B) Simplified schematic diagram of (A) that displays the relationships among the fault segments, fault right steps, and deepest extents of the grabens (blue ellipses). The black dashed line indicates the approximate outline of the southeastern side of the grabens. The right steps of the main fault (in red) and associated deepest parts of the grabens are interpreted to represent rhombochasms that developed in a right-lateral locally transtensional regime. (C) Simplified schematic diagram showing the development of a rhombochasm at the right step of a right-lateral strike-slip fault.
Figure 12. (A) Time-structure map on the top of Proterozoic basement in eastern New York State based on three-dimensional seismic surveys. Approximate location is within the eastern white-dashed box in Figure 1. Color ramp for depth is green and orange = high, blue = low. Red line indicates the generalized trace of the main series of linked northeast-striking faults. Dashed black line indicates approximate northwestern extent of significant downwarping related to the grabens. Both the black dashed line and the red line display right steps in the fault system. Brown hachured lines indicate fault traces picked on each inline and crossline (dip-slip component of fault motion is down on the hachured side). Easterly striking fault traces are indicated by red and white arrows (see text for discussion of red and white arrows). Yellow arrows indicate deepest parts of the grabens, which are located near right steps of the fault system. This geometrical relationship is especially evident in the southwestern two grabens (no. 1 and no. 2). (B) Simplified schematic diagram of (A) that displays the relationships among the fault segments, fault right steps, and deepest extents of the grabens (blue ellipses). The black dashed line indicates the approximate outline of the southeastern side of the grabens. The right steps of the main fault (in red) and associated deepest parts of the grabens are interpreted to represent rhombochasms that developed in a right-lateral locally transtensional regime. (C) Simplified schematic diagram showing the development of a rhombochasm at the right step of a right-lateral strike-slip fault.