The AAPG/Datapages Combined Publications Database
AAPG Bulletin
Figure
AAPG Bulletin; Year: 2022; Issue: December DOI: 10.1306/08182220071
Return to Full Text
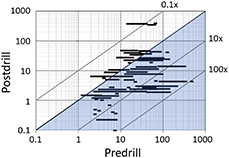
Figure 1.
Log–log crossplot of predrill versus postdrill prospect resources compiled from Norwegian Petroleum Directorate license applications. Units for both axes are millions of standard cubic meters of oil equivalent. The length of the bars represents the predrill 80% confidence range defined as a 10% chance the outcome will be below the low end of the range (known as the 90th percentile) and a 10% chance the outcome will exceed the high end of the range. Central diagonal line represents perfect prediction. Data that fall on the diagonal lines labeled 10× and 100× represent overestimation by a factor of 10 and 100, respectively. Redrawn from slide 13 from Søiland (2019).
Figure 1. Log–log crossplot of predrill versus postdrill prospect resources compiled from Norwegian Petroleum Directorate license applications. Units for both axes are millions of standard cubic meters of oil equivalent. The length of the bars represents the predrill 80% confidence range defined as a 10% chance the outcome will be below the low end of the range (known as the 90th percentile) and a 10% chance the outcome will exceed the high end of the range. Central diagonal line represents perfect prediction. Data that fall on the diagonal lines labeled 10× and 100× represent overestimation by a factor of 10 and 100, respectively. Redrawn from slide 13 from Søiland (2019).