The AAPG/Datapages Combined Publications Database
AAPG Bulletin
Figure
AAPG Bulletin; Year: 2022; Issue: December DOI: 10.1306/08182220071
Return to Full Text
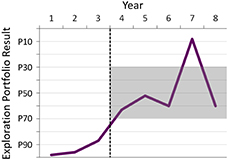
Figure 6.
A resource prediction accuracy plot. For each year, the results, as measured by the sum of the estimated ultimate recoverable resource (EUR) for the discoveries in the portfolio drilled, are plotted on the portfolio forecast, which probabilistically aggregates all of the prospects drilled by year. The EUR represents the volume of hydrocarbons, at standard conditions, that will ultimately be recovered from a reservoir before abandonment. For each year, there were at least 28 exploration wells in the portfolio. In years 1–3, the result fell below the 80th percentile (P80) of the portfolio forecast, prompting the company to instigate a reward to technical staff if the results fell between the 70th and 30th percentiles (P70 and P30) of that year’s portfolio forecast. By definition, there is an 80% chance that the results will fall at or above the P80. Simplified from McMaster and Carragher (2003) with permission.
Figure 6. A resource prediction accuracy plot. For each year, the results, as measured by the sum of the estimated ultimate recoverable resource (EUR) for the discoveries in the portfolio drilled, are plotted on the portfolio forecast, which probabilistically aggregates all of the prospects drilled by year. The EUR represents the volume of hydrocarbons, at standard conditions, that will ultimately be recovered from a reservoir before abandonment. For each year, there were at least 28 exploration wells in the portfolio. In years 1–3, the result fell below the 80th percentile (P80) of the portfolio forecast, prompting the company to instigate a reward to technical staff if the results fell between the 70th and 30th percentiles (P70 and P30) of that year’s portfolio forecast. By definition, there is an 80% chance that the results will fall at or above the P80. Simplified from McMaster and Carragher (2003) with permission.