The AAPG/Datapages Combined Publications Database
AAPG Bulletin
Figure
AAPG Bulletin; Year: 2022; Issue: December DOI: 10.1306/08182220071
Return to Full Text
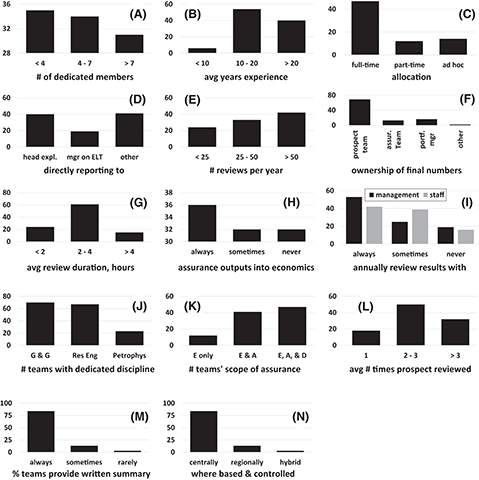
Figure 7.
For each of the plots, the y axis is the percentage of the assurance teams that selected a certain x axis category. In plot (J) (see Appendix), teams can have multiple selections, and the sum will exceed 100%. The full questions follow the plots. A = appraisal; Assur. = assurance; avg = average; D = development; E = exploration; ELT = exploration leadership team; expl. = explorer; G & G = geology and geophysics; Petrophys. = petrophysical; port. mgr. = portfolio manager; Res Eng = research engineering.
Figure 7.
For each of the plots, the