The AAPG/Datapages Combined Publications Database
AAPG Bulletin
Figure
AAPG Bulletin; Year: 2024; Issue: February DOI: 10.1306/12202222033
Return to Full Text
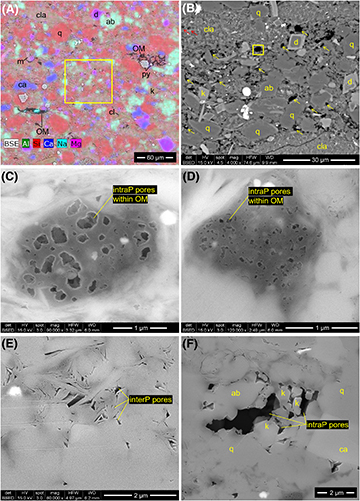
Figure 10.
Organic-rich siliceous mudstone lithofacies: field emission-scanning electron microscopy (SEM) images of argon ion beam milled sample. (A) Low-magnification color energy-dispersive spectroscopy elemental map (Al is green, Si is red, Ca is dark blue, Na is aqua, and Mg is magenta) superimposed on backscattered electron (BSE)-SEM image showing silt quartz (q), albite (ab), dolomite (d), calcite (ca), clays (cl), clay-mineral aggregate (cla), mica (m), potassium feldspar (k), pyrite (py) and organic matter (OM). Sample PN3-108. (B) Enlargement of yellow-framed area in (A). Organic matter fills most pores between clay- to silt-size matrix components (yellow arrows). (C) Enlargement of yellow-framed area in (B) showing porous organic matter particle enclosed by clays and other rigid grains in the matrix. (D) Image showing intraparticle (intraP) pores within the organic matter. Sample PN3-108. (E) Image showing interparticle pores between clays and other grains. Sample PN6-75. (F) Image of intraparticle pores within potassium feldspar. We interpret that the partial dissolution of the potassium feldspar formed these pores. The potassium feldspar grains shown in the image correspond to the nondissolved areas of the mineral. Sample PN6-75. BSED = backscattered electron detector; det = detector; HFW = horizontal field width; HV = high voltage (accelerating voltage); mag = magnification; spot = spot size; WD = working distance.
Figure 10. Organic-rich siliceous mudstone lithofacies: field emission-scanning electron microscopy (SEM) images of argon ion beam milled sample. (A) Low-magnification color energy-dispersive spectroscopy elemental map (Al is green, Si is red, Ca is dark blue, Na is aqua, and Mg is magenta) superimposed on backscattered electron (BSE)-SEM image showing silt quartz (q), albite (ab), dolomite (d), calcite (ca), clays (cl), clay-mineral aggregate (cla), mica (m), potassium feldspar (k), pyrite (py) and organic matter (OM). Sample PN3-108. (B) Enlargement of yellow-framed area in (A). Organic matter fills most pores between clay- to silt-size matrix components (yellow arrows). (C) Enlargement of yellow-framed area in (B) showing porous organic matter particle enclosed by clays and other rigid grains in the matrix. (D) Image showing intraparticle (intraP) pores within the organic matter. Sample PN3-108. (E) Image showing interparticle pores between clays and other grains. Sample PN6-75. (F) Image of intraparticle pores within potassium feldspar. We interpret that the partial dissolution of the potassium feldspar formed these pores. The potassium feldspar grains shown in the image correspond to the nondissolved areas of the mineral. Sample PN6-75. BSED = backscattered electron detector; det = detector; HFW = horizontal field width; HV = high voltage (accelerating voltage); mag = magnification; spot = spot size; WD = working distance.