The AAPG/Datapages Combined Publications Database
AAPG Bulletin
Figure
AAPG Bulletin; Year: 2024; Issue: February DOI: 10.1306/12202222033
Return to Full Text
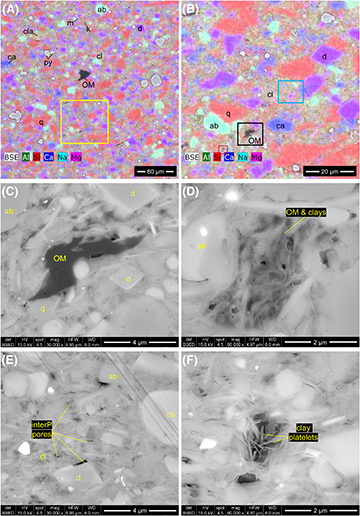
Figure 12.
Argillaceous mudstone lithofacies: field emission-scanning electron microscopy (SEM) images of argon ion beam milled sample. (A) Low-magnification color energy-dispersive spectroscopy elemental map (Al is green, Si is red, Ca is dark blue, Na is aqua, and Mg is magenta) superimposed on backscattered electron (BSE)-SEM image showing silt quartz (q), albite (ab), dolomite (d), calcite (ca), clays (cl), clay-mineral aggregate (cla), mica (m), potassium feldspar (k), pyrite (py) and organic matter (OM). (B) Enlargement of yellow-framed area in (A), showing that clays dominate the composition of this lithofacies. Clay- to silt-size grains of detrital quartz and dolomite crystals are scattered throughout the rock. (C) Enlargement of black-framed area in (B) showing a deformed organic matter particle surrounded by clays and other grains in the matrix. This organic matter particle has only a few intraparticle pores. (D) Enlargement of green-framed area in (B) showing porous organic matter intermixed with abundant clays. (E) Enlargement of blue-framed area in (B) showing nanometer-size interparticle pores between clays and between clays and other grains. (F) Enlargement of red-framed area in (B) showing interparticle pores between randomly oriented clays. All of the images are from sample PND-3. BSED = backscattered electron detector; det = detector; HFW = horizontal field width; HV = high voltage (accelerating voltage); mag = magnification; spot = spot size; WD = working distance.
Figure 12. Argillaceous mudstone lithofacies: field emission-scanning electron microscopy (SEM) images of argon ion beam milled sample. (A) Low-magnification color energy-dispersive spectroscopy elemental map (Al is green, Si is red, Ca is dark blue, Na is aqua, and Mg is magenta) superimposed on backscattered electron (BSE)-SEM image showing silt quartz (q), albite (ab), dolomite (d), calcite (ca), clays (cl), clay-mineral aggregate (cla), mica (m), potassium feldspar (k), pyrite (py) and organic matter (OM). (B) Enlargement of yellow-framed area in (A), showing that clays dominate the composition of this lithofacies. Clay- to silt-size grains of detrital quartz and dolomite crystals are scattered throughout the rock. (C) Enlargement of black-framed area in (B) showing a deformed organic matter particle surrounded by clays and other grains in the matrix. This organic matter particle has only a few intraparticle pores. (D) Enlargement of green-framed area in (B) showing porous organic matter intermixed with abundant clays. (E) Enlargement of blue-framed area in (B) showing nanometer-size interparticle pores between clays and between clays and other grains. (F) Enlargement of red-framed area in (B) showing interparticle pores between randomly oriented clays. All of the images are from sample PND-3. BSED = backscattered electron detector; det = detector; HFW = horizontal field width; HV = high voltage (accelerating voltage); mag = magnification; spot = spot size; WD = working distance.