The AAPG/Datapages Combined Publications Database
AAPG Bulletin
Figure
AAPG Bulletin; Year: 2024; Issue: February DOI: 10.1306/12202222033
Return to Full Text

Figure 22.
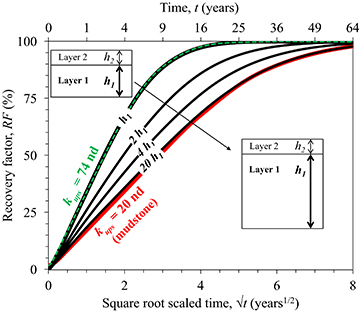
Simulation results for layered model with increasing thickness of the low-permeability layer (h1). The dashed green line represents the matched production behavior in a Wolfcamp A homogeneous model, with a single upscaled permeability (kups) of 74 nd. The red curve is the production in a homogeneous model composed on only low-permeability strata, with a kups of 20 nd. As h1 increases, the production rates decrease and the kups approaches 20 nd. The recovery factor (RF) is the cumulative produced pore volume over the maximum producible pore volume for the given model parameters. The RF is 100% when the pore pressure in the domain equilibrates with the pressure in the fracture. h2 = thickness of the high-permeability layer (layer 2).

Figure 22. Simulation results for layered model with increasing thickness of the low-permeability layer (h1). The dashed green line represents the matched production behavior in a Wolfcamp A homogeneous model, with a single upscaled permeability (kups) of 74 nd. The red curve is the production in a homogeneous model composed on only low-permeability strata, with a kups of 20 nd. As h1 increases, the production rates decrease and the kups approaches 20 nd. The recovery factor (RF) is the cumulative produced pore volume over the maximum producible pore volume for the given model parameters. The RF is 100% when the pore pressure in the domain equilibrates with the pressure in the fracture. h2 = thickness of the high-permeability layer (layer 2).