The AAPG/Datapages Combined Publications Database
AAPG Bulletin
Figure
AAPG Bulletin; Year: 2024; Issue: February DOI: 10.1306/12202222033
Return to Full Text
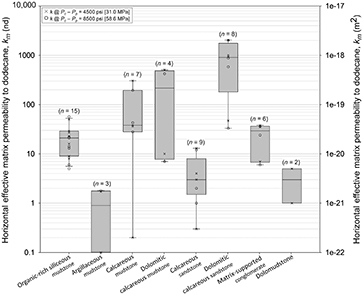
Figure 9.
Horizontal effective matrix permeability to dodecane (km) of all of the samples measured by lithofacies. For each lithofacies, the top and bottom lines represent the maximum and minimum values, respectively. The top and bottom edges of the gray box mark the first and third percentiles, respectively. The median value is the horizontal line within the box. Values that fall beyond the lower limit (25th percentile − 1.5 × interquartile range) and the upper limit (75th percentile + 1.5 × interquartile range) represent outliers. The n represents the number of permeability measurements conducted at confining pressure (Pc) − pore pressure (Pp) = 4500 psi (cross) and Pc − Pp = 8500 psi (circles) per lithofacies.
Figure 9. Horizontal effective matrix permeability to dodecane (km) of all of the samples measured by lithofacies. For each lithofacies, the top and bottom lines represent the maximum and minimum values, respectively. The top and bottom edges of the gray box mark the first and third percentiles, respectively. The median value is the horizontal line within the box. Values that fall beyond the lower limit (25th percentile − 1.5 × interquartile range) and the upper limit (75th percentile + 1.5 × interquartile range) represent outliers. The n represents the number of permeability measurements conducted at confining pressure (Pc) − pore pressure (Pp) = 4500 psi (cross) and Pc − Pp = 8500 psi (circles) per lithofacies.