The AAPG/Datapages Combined Publications Database
AAPG Bulletin
Figure
AAPG Bulletin; Year: 2025; Issue: April DOI: 10.1306/02262523078
Return to Full Text
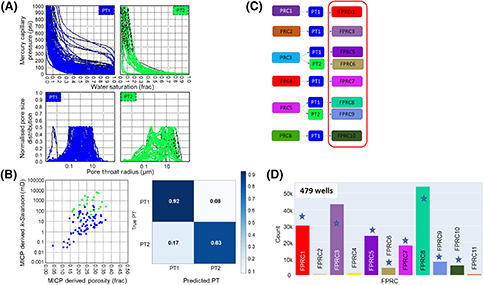
Figure 12. Case study: Data-dense Middle East Thamama B or Kharaib-2. (A) Multiresolution graph-based clustering analysis of pore types (PT) from mercury injection capillary porosimetry (MICP) resulted in two distinct PTs shown here as capillary pressure curves (top) and pore size distributions (bottom). (B) The same PTs propagated into core domain and shown in a crossplot between effective porosity and permeability (left) and prediction scores following propagation into the log domain (right). (C) The PTs nested in the petrophysical rock categories (PRC) and defining the final PRCs (FPRC). (D) Bar diagram display of FPRCs allows reduction to eight proportionally relevant categories (indicated by stars). frac = fractional; Poro/Perm = porosity/permeability; PSD = pore size distribution.
Figure 12. Case study: Data-dense Middle East Thamama B or Kharaib-2. (A) Multiresolution graph-based clustering analysis of pore types (PT) from mercury injection capillary porosimetry (MICP) resulted in two distinct PTs shown here as capillary pressure curves (top) and pore size distributions (bottom). (B) The same PTs propagated into core domain and shown in a crossplot between effective porosity and permeability (left) and prediction scores following propagation into the log domain (right). (C) The PTs nested in the petrophysical rock categories (PRC) and defining the final PRCs (FPRC). (D) Bar diagram display of FPRCs allows reduction to eight proportionally relevant categories (indicated by stars). frac = fractional; Poro/Perm = porosity/permeability; PSD = pore size distribution.