The AAPG/Datapages Combined Publications Database
AAPG Bulletin
Figure
AAPG Bulletin; Year: 2025; Issue: April DOI: 10.1306/02262523078
Return to Full Text
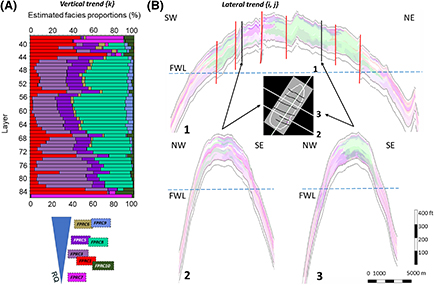
Figure 14. Case study: Data-dense Middle East Thamama B or Kharaib-2. (A) Vertical proportion curve showing a stratigraphic waning and waxing of reservoir quality (RQ)-based final petrophysical rock categories (FPRC) that resemble an intrinsic relative sea-level signal. The inverted triangle near the bottom shows the relative reservoir quality of the FPRCs. (B) Cross sections through a kriged representation of proportional (FPRCs) with original colors (see (A) as pastel version). Section 1 has a longitudinal direction, whereas sections 2 and 3 are transverse located in the northwest and southeast, respectively. Pastel green, pastel rose, pastel light pink, and pastel violet colors represent, respectively, FPRC8, -1, -5, and -9. FPRC5, -8, and -9 represent an increasing RQ and FPRC1 represents a very low RQ. FWL = free water level.
Figure 14. Case study: Data-dense Middle East Thamama B or Kharaib-2. (A) Vertical proportion curve showing a stratigraphic waning and waxing of reservoir quality (RQ)-based final petrophysical rock categories (FPRC) that resemble an intrinsic relative sea-level signal. The inverted triangle near the bottom shows the relative reservoir quality of the FPRCs. (B) Cross sections through a kriged representation of proportional (FPRCs) with original colors (see (A) as pastel version). Section 1 has a longitudinal direction, whereas sections 2 and 3 are transverse located in the northwest and southeast, respectively. Pastel green, pastel rose, pastel light pink, and pastel violet colors represent, respectively, FPRC8, -1, -5, and -9. FPRC5, -8, and -9 represent an increasing RQ and FPRC1 represents a very low RQ. FWL = free water level.