The AAPG/Datapages Combined Publications Database
AAPG Bulletin
Figure
AAPG Bulletin; Year: 2025; Issue: April DOI: 10.1306/02262523078
Return to Full Text
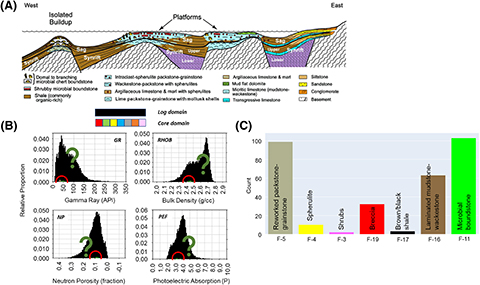
Figure 15. Case study 4: West Africa Pre-Salt Aptian. (A) This diagram shows the inferred depositional setting and make-up for the target project (after Saller et al., 2016). (B, C) Bar diagrams showing range and relative proportions for four main log types (black) and contributions by sedimentary facies (colored). (C) Bar diagram showing relative proportions of sedimentary facies (here labelled “FA”) based on three cored wells, rotary sidewall cores and cuttings. Box near bottom shows the sedimentary facies definitions. GR = gamma ray; NP = neutron porosity; PEF = photoelectric; RHOB = bulk density.
Figure 15. Case study 4: West Africa Pre-Salt Aptian. (A) This diagram shows the inferred depositional setting and make-up for the target project (after Saller et al., 2016). (B, C) Bar diagrams showing range and relative proportions for four main log types (black) and contributions by sedimentary facies (colored). (C) Bar diagram showing relative proportions of sedimentary facies (here labelled “FA”) based on three cored wells, rotary sidewall cores and cuttings. Box near bottom shows the sedimentary facies definitions. GR = gamma ray; NP = neutron porosity; PEF = photoelectric; RHOB = bulk density.